OPEN-SOURCE SCRIPT
Atualizado Dot indicator - Daily candle opened above the daily EMA baseline
https://www.tradingview.com/x/PHTOoLHz/
//version=3
//Written by David Carruthers
//Objective
//This is to support scanning the market to check if the daily candle opened above the daily EMA baseline for a selected pair
//This can be done in some measure by using trading view's screening tools
//However it would be useful, if someone references a pair, to instantly see if that pair opened above the daily baseline regardless of what resolution you are in
//This script, works out a green dot if the pairs daily candle opened above the daily EMA baseline, and a red dot if it didn't
//It then displays a green or red dot on the open for the last candle you are looking at regardless of resolution
//This saves jumping back and forth between the daily resolution and current resolution
Note please excuse my Pine scripting I am new to it :-)
Notas de Lançamento
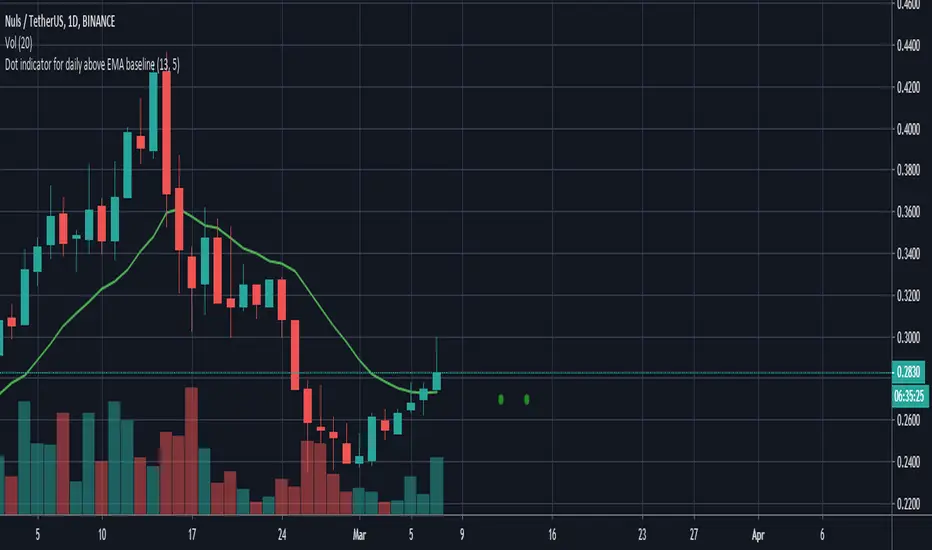
Brand new version of the Daily baseline scriptThere are now 2 x dots offset to the right
Left dot: Did the current daily candle open above the daily EMA baseline ?
Right dot: Did the latest candle in the current resolution open above the Daily EMA baseline?
This allows you to keep on an resolution, for example 1 hour, and if I see a green dot to the left and a red dot to the right, I can see that the daily candle opened above the EMA baseline, but the current hourly is below it.
Script de código aberto
Em verdadeiro espírito do TradingView, o criador deste script o tornou de código aberto, para que os traders possam revisar e verificar sua funcionalidade. Parabéns ao autor! Embora você possa usá-lo gratuitamente, lembre-se de que a republicação do código está sujeita às nossas Regras da Casa.
Aviso legal
As informações e publicações não se destinam a ser, e não constituem, conselhos ou recomendações financeiras, de investimento, comerciais ou de outro tipo fornecidos ou endossados pela TradingView. Leia mais nos Termos de Uso.