OPEN-SOURCE SCRIPT
Daily Performance Heatmap

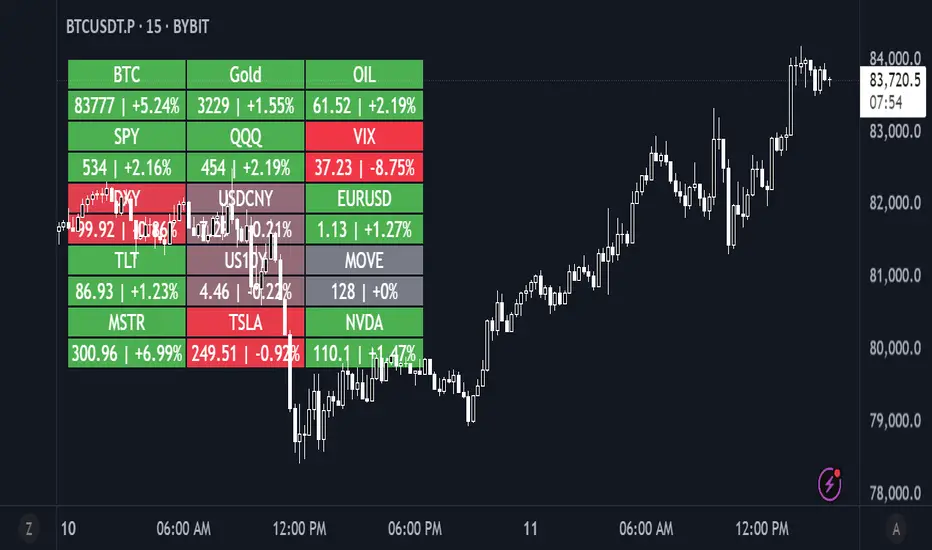
This script displays a customizable daily performance heatmap for key assets across crypto, equities, bonds, commodities, currencies, and volatility indices.
Each cell shows the current price and the percent change since the daily open, color-coded using a gradient from negative to positive. Assets are arranged in a left-to-right, top-down grid, with adjustable layout and styling.
⚙️ Features:
🔢 Displays current price and daily % change
🎨 Color-coded heatmap using customizable gradients
🧱 Adjustable layout: number of columns, cell size, and text size
🧠 Smart price formatting (no decimals for BTC, Gold, etc.)
🪟 Clean alignment with padded spacing for UI clarity
🛠️ Future plans:
User-input asset lists and labels
Category grouping and dynamic sorting
Optional icons, tooltips, or alerts
Script de código aberto
Em verdadeiro espírito do TradingView, o criador deste script o tornou de código aberto, para que os traders possam revisar e verificar sua funcionalidade. Parabéns ao autor! Embora você possa usá-lo gratuitamente, lembre-se de que a republicação do código está sujeita às nossas Regras da Casa.
Aviso legal
As informações e publicações não se destinam a ser, e não constituem, conselhos ou recomendações financeiras, de investimento, comerciais ou de outro tipo fornecidos ou endossados pela TradingView. Leia mais nos Termos de Uso.