OPEN-SOURCE SCRIPT
Fundamentals Panel
Fundamentals Panel Description
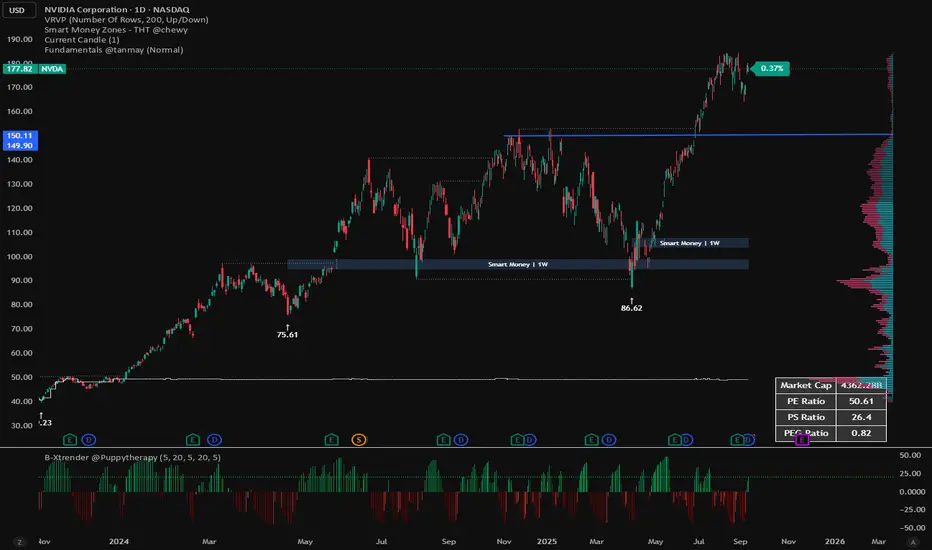
The Fundamentals Panel is a versatile Pine Script indicator that displays key financial metrics—Market Cap, P/E Ratio, P/S Ratio, and PEG Ratio—in a clean, customizable table on your TradingView chart. Designed for investors and traders, this tool brings essential company fundamentals directly to your chart, saving time and enhancing decision-making.
Quick Insights: View critical valuation metrics (Market Cap, P/E, P/S, PEG) at a glance without leaving your chart, ideal for fundamental analysis or screening stocks.
Customizable Display: Toggle each metric on or off via input settings to focus on what matters most to your strategy.
Adjustable Font Size: Choose from Small, Normal, or Large text sizes to ensure readability suits your chart setup and screen preferences.
Reliable Data: Pulls data directly from TradingView’s financial database, using diluted shares and trailing metrics for accuracy across most stocks.
Debugging Support: Includes hidden plots (visible in the Data Window) to verify raw data like shares outstanding, revenue, and PEG, helping you trust the numbers.
How It Works
The indicator fetches:
Market Cap: Calculated using diluted shares outstanding and current price.
P/E Ratio: Price divided by trailing twelve-month (TTM) diluted EPS.
P/S Ratio: Market cap divided by TTM total revenue.
PEG Ratio: Trailing PEG from TradingView’s data, with an additional calculated PEG for cross-checking.
Script de código aberto
Em verdadeiro espírito do TradingView, o criador deste script o tornou de código aberto, para que os traders possam revisar e verificar sua funcionalidade. Parabéns ao autor! Embora você possa usá-lo gratuitamente, lembre-se de que a republicação do código está sujeita às nossas Regras da Casa.
Aviso legal
As informações e publicações não se destinam a ser, e não constituem, conselhos ou recomendações financeiras, de investimento, comerciais ou de outro tipo fornecidos ou endossados pela TradingView. Leia mais nos Termos de Uso.