OPEN-SOURCE SCRIPT
Kumo Implied Volatility
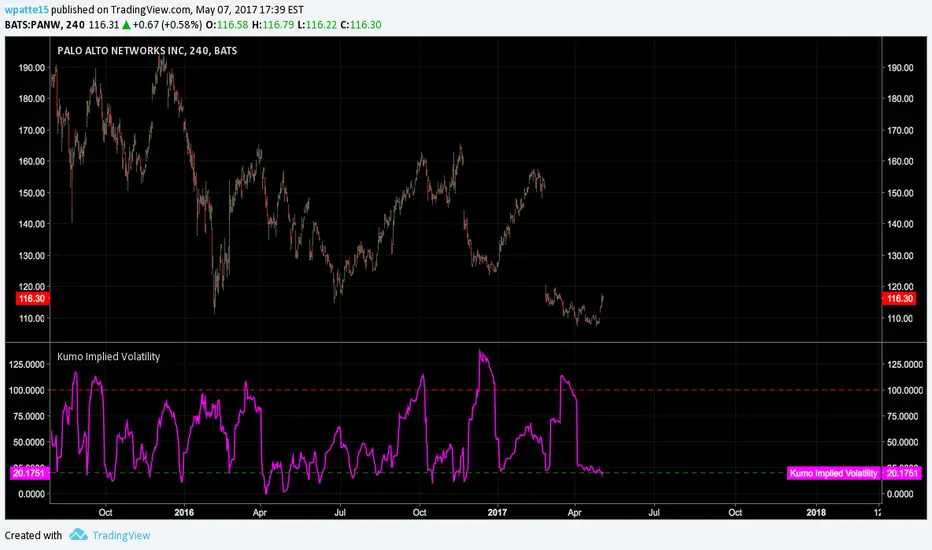
From ProRealCode prorealcode.com/prorealtime-indicators/kumo-implied-volatility/:
"In my pursuit to quantify the Ichimoku indicator, I have tried to quantify implied volatility by measuring the Kumo thickness. Firstly, I took the absolute value of the distance between SpanA and SpanB, I then normalized the value and created standard deviation bands. Now I can compare the Kumo thickness with the average thickness over 200 periods. When the value goes above 100, it implies that the Kumo is thicker than 2 standard deviations of the average (there is therefore only a 5% chance that this happens). A reading over 100 might indicate trend exhaustion and a reading below 20 indicates low volatility and Kumo twists (I chose 20 only by observation and not statistical significance). Interestingly, this indicator sometime gives similar information to ADX. So far, the best use for this indicator is as a setup indicator for trend exhaustion or low volatility breakouts from Kumo twists. Extreme readings before Kumo breakouts looks interesting."
"In my pursuit to quantify the Ichimoku indicator, I have tried to quantify implied volatility by measuring the Kumo thickness. Firstly, I took the absolute value of the distance between SpanA and SpanB, I then normalized the value and created standard deviation bands. Now I can compare the Kumo thickness with the average thickness over 200 periods. When the value goes above 100, it implies that the Kumo is thicker than 2 standard deviations of the average (there is therefore only a 5% chance that this happens). A reading over 100 might indicate trend exhaustion and a reading below 20 indicates low volatility and Kumo twists (I chose 20 only by observation and not statistical significance). Interestingly, this indicator sometime gives similar information to ADX. So far, the best use for this indicator is as a setup indicator for trend exhaustion or low volatility breakouts from Kumo twists. Extreme readings before Kumo breakouts looks interesting."
Script de código aberto
Em verdadeiro espírito do TradingView, o criador deste script o tornou de código aberto, para que os traders possam revisar e verificar sua funcionalidade. Parabéns ao autor! Embora você possa usá-lo gratuitamente, lembre-se de que a republicação do código está sujeita às nossas Regras da Casa.
Aviso legal
As informações e publicações não se destinam a ser, e não constituem, conselhos ou recomendações financeiras, de investimento, comerciais ou de outro tipo fornecidos ou endossados pela TradingView. Leia mais nos Termos de Uso.