PROTECTED SOURCE SCRIPT
TDI (by Will)
The TDI is a complex indicator as long as it is based on three other popular indicators: the RSI , Moving Average, and Bollinger Bands .
The RSI helps to find out whether the current trade is "overheated". The RSI lines are smoothed out by the Moving Averages. The Bollinger Bands help to assess the oscillation amplitude of the price and the direction of the trend. Thanks to being complex, the TDI may be used as a separate trading system.
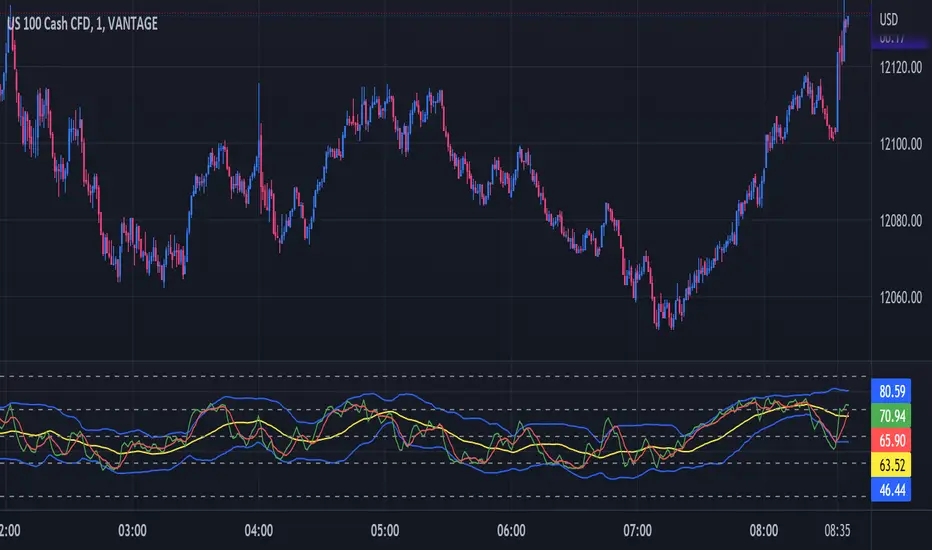
The TDI is drawn in a window below the price chart and consists of five lines: two RSI lines and three Bollinger Bands . The green RSI line is called fast, the red one is signal - it is calculated based on a longer averaging period. The RSI lines show the strength and volatility of the market. When they cross, they give short-term TDI signals.
Two of the Bollinger Bands are blue, they constitute a trading channel; the yellow line is called the middle, or main, line. The central axis of the indicator is level 50; levels 32 and 68 are also marked. The area above 68 is the overbought zone and the area below 32 is the oversold zone, as in the classical RSI .
The RSI helps to find out whether the current trade is "overheated". The RSI lines are smoothed out by the Moving Averages. The Bollinger Bands help to assess the oscillation amplitude of the price and the direction of the trend. Thanks to being complex, the TDI may be used as a separate trading system.
The TDI is drawn in a window below the price chart and consists of five lines: two RSI lines and three Bollinger Bands . The green RSI line is called fast, the red one is signal - it is calculated based on a longer averaging period. The RSI lines show the strength and volatility of the market. When they cross, they give short-term TDI signals.
Two of the Bollinger Bands are blue, they constitute a trading channel; the yellow line is called the middle, or main, line. The central axis of the indicator is level 50; levels 32 and 68 are also marked. The area above 68 is the overbought zone and the area below 32 is the oversold zone, as in the classical RSI .
Script protegido
Esse script é publicada como código fechado. No entanto, você pode gerenciar suas escolhas de bate-papo. Por favor, abra suas Configurações do perfil
Aviso legal
As informações e publicações não se destinam a ser, e não constituem, conselhos ou recomendações financeiras, de investimento, comerciais ou de outro tipo fornecidos ou endossados pela TradingView. Leia mais nos Termos de Uso.