OPEN-SOURCE SCRIPT
Atualizado Normalized RSI Trendline with Divergences
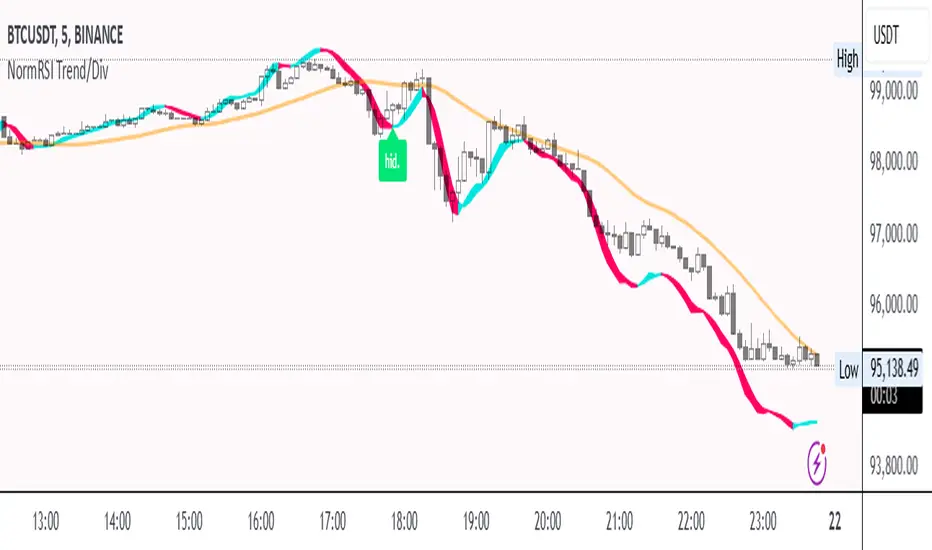
Normalized RSI Trendline with Divergences
🔹 Overview
The Normalized RSI Trendline with Divergences indicator enhances traditional RSI analysis by normalizing RSI values within a defined range and applying a trend-following approach. It also detects bullish and bearish divergences to highlight potential trend reversals.
🔹 Features
✔ Normalized RSI Calculation – The RSI values are normalized between -1 and 1 to provide a clearer representation of market momentum.
✔ Trend & Center Lines – A trendline based on linear regression and an adaptive moving average (ALMA) for smoother trend visualization.
✔ Divergence Detection – Identifies regular and hidden divergences, displaying signals directly on the chart.
✔ Customizable Parameters – Users can adjust the signal period, lookback range, trend length, and divergence sensitivity to fit different trading strategies.
🔹 How to Use
Trend Following: The trendline helps identify the overall market direction.
Divergence Signals:
🟢 Bullish Divergence (Potential upward reversal)
🔴 Bearish Divergence (Potential downward reversal)
🟩 Hidden Bullish Divergence (Trend continuation signal)
🟧 Hidden Bearish Divergence (Trend continuation signal)
This script is suitable for trend traders, swing traders, and divergence-based strategies. Customize the settings to match your preferred trading style. 🚀
📌 Disclaimer: This script is for educational purposes only and does not constitute financial advice. Always conduct your own analysis before making trading decisions.
Notas de Lançamento
🔹 Components and How They Work Together1. Normalized RSI Calculation: The traditional RSI is calculated using the `ta.rsi()` function. This RSI value is then normalized between -1 and 1 using the highest and lowest RSI values over a user-defined lookback period. This normalization process allows for easier comparison of RSI values across different instruments and timeframes, as it removes the arbitrary scaling of the standard RSI. The formula used for normalization is: `Norm = 2 * ((kaynak - Min) / (Max - Min)) - 1` where `rsi` is the RSI value, `Min` is the lowest RSI value over the lookback period, and `Max` is the highest RSI value over the lookback period.
2. Trend and Center Lines: A trendline is calculated using linear regression (`ta.linreg()`) applied to the normalized RSI. This line represents the overall trend direction of the normalized RSI. An adaptive moving average (ALMA) (`ta.alma()`) is also calculated and plotted as a center line. The ALMA is used to smooth the normalized RSI and provide a more dynamic representation of the trend compared to a simple moving average. The trendline and center line work together to visualize the trend and its deviations. The normalized RSI is smoothed using a weighted moving average (`ta.wma()`) and standard deviation (`ta.stdev()`) before the linear regression is applied. This further refines the trend representation.
3. Divergence Detection: The script identifies both regular and hidden bullish and bearish divergences between the normalized RSI and price action. Pivot points are detected using `ta.pivothigh()` and `ta.pivotlow()` over a user-defined range. Divergences are identified by comparing the pivot points and corresponding normalized RSI values. For example, a bullish divergence is detected when the price makes a lower low while the normalized RSI makes a higher low. These divergences are then marked on the chart with labels.
🔹 Features
* Normalized RSI: Provides a consistent momentum indicator.
* Trendline and Center Line: Visualizes the overall trend direction and potential deviations.
* Divergence Detection: Identifies potential trend reversal points.
* Customizable Parameters: Allows users to adjust the signal period, lookback range, trend length, and divergence sensitivity to optimize the indicator for different trading strategies and market conditions.
🔹 How to Use
1. Trend Following: Use the trendline to identify the overall direction of the normalized RSI. A rising trendline suggests upward momentum, while a falling trendline suggests downward momentum.
2. Divergence Signals:
* 🟢 Bullish Divergence: Potential upward reversal.
* 🔴 Bearish Divergence: Potential downward reversal.
* 🟩 Hidden Bullish Divergence: Trend continuation signal.
* 🟧 Hidden Bearish Divergence: Trend continuation signal.
3. Combined Analysis: Use the normalized RSI, trendline, center line, and divergence signals together to make informed trading decisions. For example, a bullish divergence occurring near a rising trendline could signal a strong potential upward move.
🔹What's new with this update?
The "Divergence selection" section has been added to allow the user to choose between "RSI" (standard) and "Normalized RSI" as the divergence detection indicator.
Notas de Lançamento
Normalization calculation revised. Denominator was incorrectly modified in the last update.Script de código aberto
Em verdadeiro espírito do TradingView, o criador deste script o tornou de código aberto, para que os traders possam revisar e verificar sua funcionalidade. Parabéns ao autor! Embora você possa usá-lo gratuitamente, lembre-se de que a republicação do código está sujeita às nossas Regras da Casa.
Aviso legal
As informações e publicações não se destinam a ser, e não constituem, conselhos ou recomendações financeiras, de investimento, comerciais ou de outro tipo fornecidos ou endossados pela TradingView. Leia mais nos Termos de Uso.
Script de código aberto
Em verdadeiro espírito do TradingView, o criador deste script o tornou de código aberto, para que os traders possam revisar e verificar sua funcionalidade. Parabéns ao autor! Embora você possa usá-lo gratuitamente, lembre-se de que a republicação do código está sujeita às nossas Regras da Casa.
Aviso legal
As informações e publicações não se destinam a ser, e não constituem, conselhos ou recomendações financeiras, de investimento, comerciais ou de outro tipo fornecidos ou endossados pela TradingView. Leia mais nos Termos de Uso.