OPEN-SOURCE SCRIPT
NQ YM Correlation 1 min data
Overview
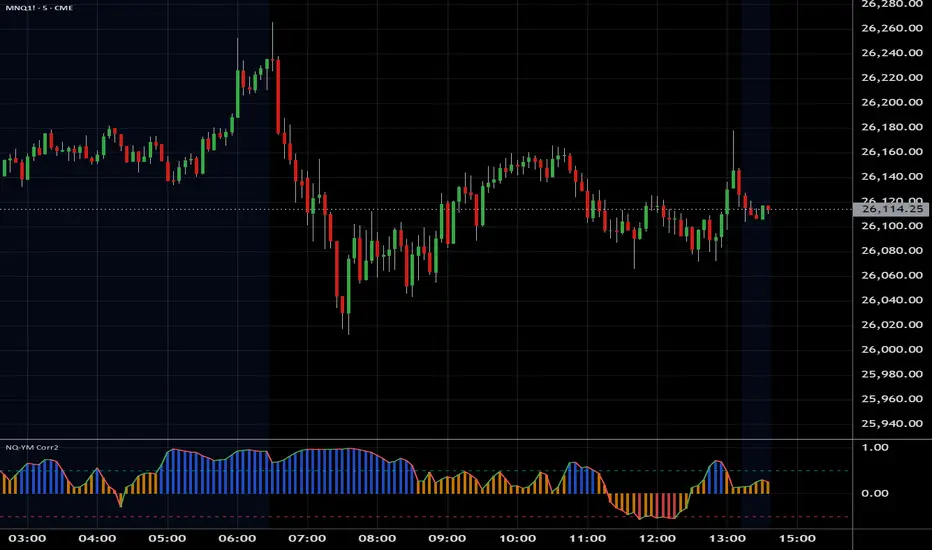
This indicator plots the correlation between Nasdaq 100 (NQ) and Dow Jones (YM) futures. It is specifically designed to act as an "Engine RPM" gauge for pairs traders who trade divergence or spread breakouts—not mean reversion.
To ensure consistent readings, this indicator always calculates using a 1-minute timeframe data, regardless of the chart timeframe you are currently viewing.
The core idea is:
High Correlation (Blue Zone): "Low RPM" or "Engine Idle." NQ and YM are moving together. The spread is flat. This is a no-trade zone.
Low Correlation (Red Zone): "High RPM" or "Engine Hot." NQ and YM are diverging. The spread is moving. This is the primary trade zone.
Script de código aberto
Em verdadeiro espírito do TradingView, o criador deste script o tornou de código aberto, para que os traders possam revisar e verificar sua funcionalidade. Parabéns ao autor! Embora você possa usá-lo gratuitamente, lembre-se de que a republicação do código está sujeita às nossas Regras da Casa.
Aviso legal
As informações e publicações não se destinam a ser, e não constituem, conselhos ou recomendações financeiras, de investimento, comerciais ou de outro tipo fornecidos ou endossados pela TradingView. Leia mais nos Termos de Uso.