PROTECTED SOURCE SCRIPT
Atualizado MTF RSI Grid with MFI [checkm8]
Hello and welcome to my version of the multi-timeframe RSI grid, with MFI.
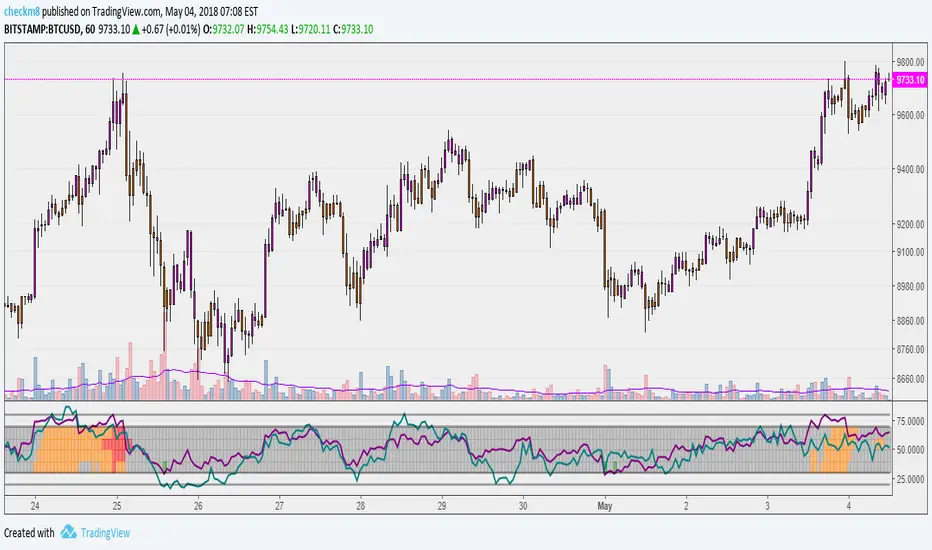
This oscillator is relatively simple and plots four sets of timeframes (selected by the user) within the levels between 30 and 70. In addition to this, it plots the RSI from the current timeframe, as well as the MFI.
As per the default settings:
1) The grid will show lime-colored blocks when the RSI is below 20 and green blocks when RSI is below 30.
2) The grid will show red-colored blocks when RSI is above 80 and orange blocks when RSI is above 70.
3) The initial MTF setup is set to 1 Hour, 2 Hour, 3 Hour, and 4 Hour timeframes. You can adjust this to your preference in the oscillator settings.
4) The purple line is RSI, the teal line is MFI.
Note: the grid only displays RSI values, not MFI.
Happy trading!
Notas de Lançamento
Fix for MTF grid (re: TradingView columns visual update)Script protegido
Esse script é publicada como código fechado. No entanto, você pode gerenciar suas escolhas de bate-papo. Por favor, abra suas Configurações do perfil
Aviso legal
As informações e publicações não se destinam a ser, e não constituem, conselhos ou recomendações financeiras, de investimento, comerciais ou de outro tipo fornecidos ou endossados pela TradingView. Leia mais nos Termos de Uso.
Script protegido
Esse script é publicada como código fechado. No entanto, você pode gerenciar suas escolhas de bate-papo. Por favor, abra suas Configurações do perfil
Aviso legal
As informações e publicações não se destinam a ser, e não constituem, conselhos ou recomendações financeiras, de investimento, comerciais ou de outro tipo fornecidos ou endossados pela TradingView. Leia mais nos Termos de Uso.