OPEN-SOURCE SCRIPT
Anand Bollinger Bands - Linear Regression Slope
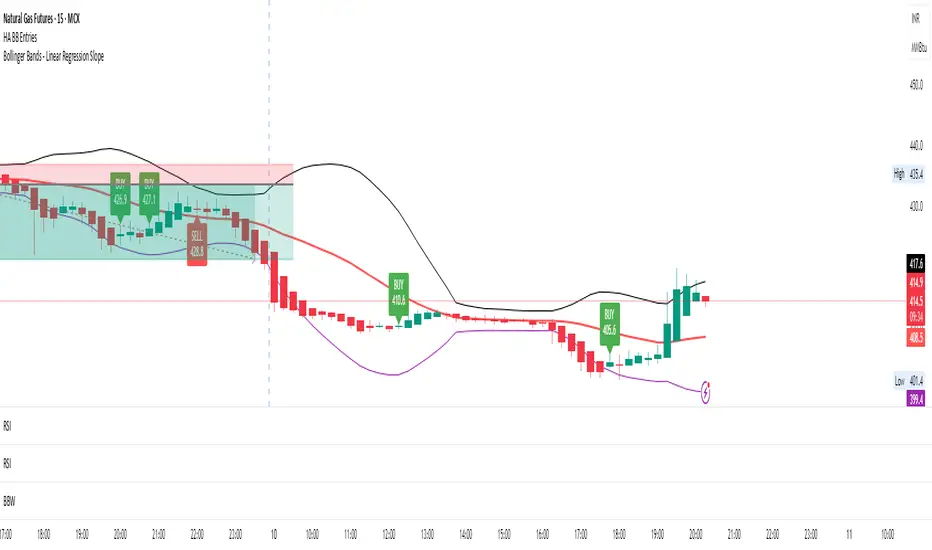
Summary
Bollinger Bands show price volatility using SMA ± standard deviation
Linear Regression calculates the mathematical trend through the middle line
Slope comparison (current vs. previous) determines if trend is rising or falling
Color changes based on that trend: Green = up, Red = down
Uses same period for both BB and slope = everything stays synchronized
The result: A visual indicator that shows you not just where price is relative to volatility, but also which direction the trend is actually moving!
Script de código aberto
Em verdadeiro espírito do TradingView, o criador deste script o tornou de código aberto, para que os traders possam revisar e verificar sua funcionalidade. Parabéns ao autor! Embora você possa usá-lo gratuitamente, lembre-se de que a republicação do código está sujeita às nossas Regras da Casa.
Aviso legal
As informações e publicações não se destinam a ser, e não constituem, conselhos ou recomendações financeiras, de investimento, comerciais ou de outro tipo fornecidos ou endossados pela TradingView. Leia mais nos Termos de Uso.