PROTECTED SOURCE SCRIPT
AlphaBeta Edge — VPA Volume Angles
📘 How the Indicator Works — User Guide
1. Volume Pressure (VPA Logic)
The indicator reads volume activity and matches it with the candle direction.
If volume supports bullish candles → it highlights buying pressure.
If volume supports bearish candles → it highlights selling pressure.
✅ How to use: You don’t need to activate this, it runs automatically. Look at the color signals on the chart (green = buying, red = selling).
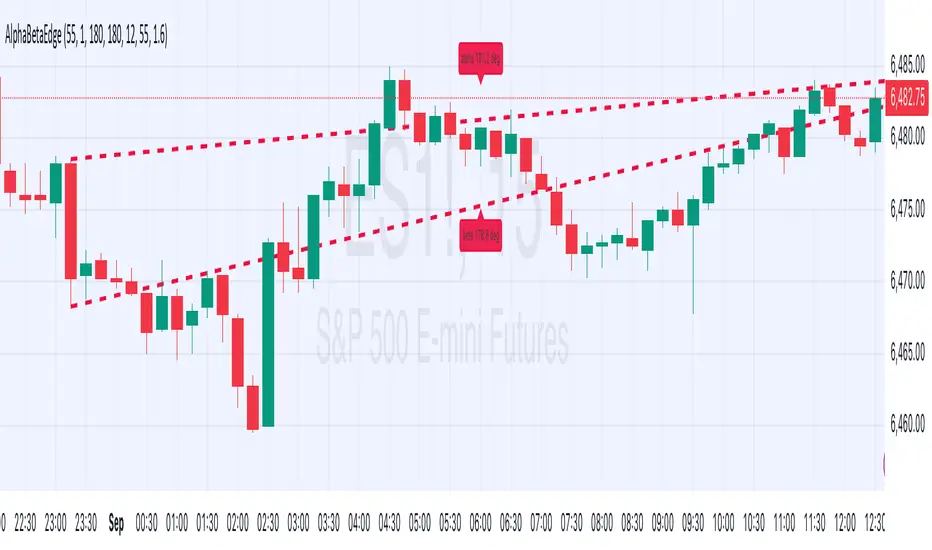
2. Angle Measurement (Alpha & Beta)
Two angles (α and β) are drawn between swing points (A–B–C).
Steeper angles mean stronger market moves.
Softer angles mean weakening momentum.
✅ How to use: Angles are visible as lines on the chart. You can check them visually or set alerts when they become too steep (potential breakout).
3. Dynamic Trendlines
The indicator automatically draws support and resistance lines connecting swing highs and lows.
These trendlines update as the market creates new swings.
✅ How to use: No setup required. Watch for price touching or breaking these lines — they often signal continuation or reversal zones.
4. Alerts
Built-in alerts notify you when:
Buying pressure is detected.
Selling pressure is detected.
Angles (α or β) reach critical levels.
✅ How to activate:
Right-click on the chart → “Add alert”.
Choose this indicator → select the condition (e.g., “Buying Pressure Detected”).
Customize the notification (pop-up, email, or app alert).
5. Color Coding
Green signals = bullish pressure.
Red signals = bearish pressure.
Neutral or indecision areas may show another color.
✅ How to use: Colors update automatically; you don’t need to configure them. Simply follow the visual bias.
6. Custom Settings (Inputs Panel)
You can personalize how sensitive the indicator is:
Swing Length → Controls how far back the indicator looks for A–B–C points. Longer = fewer but stronger signals. Shorter = more frequent but noisier signals.
Volume Sensitivity → Adjusts how much volume is required to confirm pressure.
Alerts Toggle → You can enable or disable different alerts.
✅ How to activate/deactivate:
Go to the indicator settings (⚙️ icon in TradingView).
Adjust parameters to fit your trading style (scalping, swing, or long-term).
⚠️ Disclaimer
This indicator is for educational purposes only.
It is not financial advice and does not guarantee profits.
Always apply proper risk management and confirm with your own analysis.
1. Volume Pressure (VPA Logic)
The indicator reads volume activity and matches it with the candle direction.
If volume supports bullish candles → it highlights buying pressure.
If volume supports bearish candles → it highlights selling pressure.
✅ How to use: You don’t need to activate this, it runs automatically. Look at the color signals on the chart (green = buying, red = selling).
2. Angle Measurement (Alpha & Beta)
Two angles (α and β) are drawn between swing points (A–B–C).
Steeper angles mean stronger market moves.
Softer angles mean weakening momentum.
✅ How to use: Angles are visible as lines on the chart. You can check them visually or set alerts when they become too steep (potential breakout).
3. Dynamic Trendlines
The indicator automatically draws support and resistance lines connecting swing highs and lows.
These trendlines update as the market creates new swings.
✅ How to use: No setup required. Watch for price touching or breaking these lines — they often signal continuation or reversal zones.
4. Alerts
Built-in alerts notify you when:
Buying pressure is detected.
Selling pressure is detected.
Angles (α or β) reach critical levels.
✅ How to activate:
Right-click on the chart → “Add alert”.
Choose this indicator → select the condition (e.g., “Buying Pressure Detected”).
Customize the notification (pop-up, email, or app alert).
5. Color Coding
Green signals = bullish pressure.
Red signals = bearish pressure.
Neutral or indecision areas may show another color.
✅ How to use: Colors update automatically; you don’t need to configure them. Simply follow the visual bias.
6. Custom Settings (Inputs Panel)
You can personalize how sensitive the indicator is:
Swing Length → Controls how far back the indicator looks for A–B–C points. Longer = fewer but stronger signals. Shorter = more frequent but noisier signals.
Volume Sensitivity → Adjusts how much volume is required to confirm pressure.
Alerts Toggle → You can enable or disable different alerts.
✅ How to activate/deactivate:
Go to the indicator settings (⚙️ icon in TradingView).
Adjust parameters to fit your trading style (scalping, swing, or long-term).
⚠️ Disclaimer
This indicator is for educational purposes only.
It is not financial advice and does not guarantee profits.
Always apply proper risk management and confirm with your own analysis.
Script protegido
Esse script é publicada como código fechado. No entanto, você pode usar ele livremente e sem nenhuma limitação – saiba mais aqui.
Join my trading community on Discord! 📈 Use all our indicators for FREE
discord.gg/xPEDcNEupw
discord.gg/xPEDcNEupw
Aviso legal
As informações e publicações não devem ser e não constituem conselhos ou recomendações financeiras, de investimento, de negociação ou de qualquer outro tipo, fornecidas ou endossadas pela TradingView. Leia mais em Termos de uso.