OPEN-SOURCE SCRIPT
Percentage MACD Enhanced 3
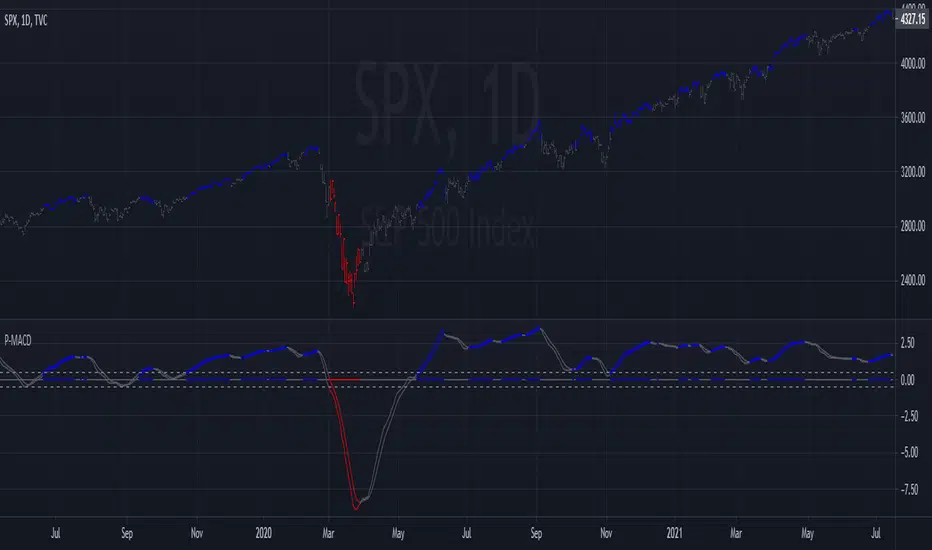
This MACD is calculated using percentage above or below the zero line for consistency and compatibility across different stocks and markets. The price bars are colored when MACD is above/below extreme levels and crossed in that direction. The intention is to use this setting on a longer time frame and trade only in the direction the bars are colored. This setting is also a powerful way to take profits! As usual, my scripts are public for scrutiny and to adjust for your personal needs.
Script de código aberto
Em verdadeiro espírito do TradingView, o criador deste script o tornou de código aberto, para que os traders possam revisar e verificar sua funcionalidade. Parabéns ao autor! Embora você possa usá-lo gratuitamente, lembre-se de que a republicação do código está sujeita às nossas Regras da Casa.
Aviso legal
As informações e publicações não se destinam a ser, e não constituem, conselhos ou recomendações financeiras, de investimento, comerciais ou de outro tipo fornecidos ou endossados pela TradingView. Leia mais nos Termos de Uso.