OPEN-SOURCE SCRIPT
PCE Inflation Monitor (Change YoY & MoM)
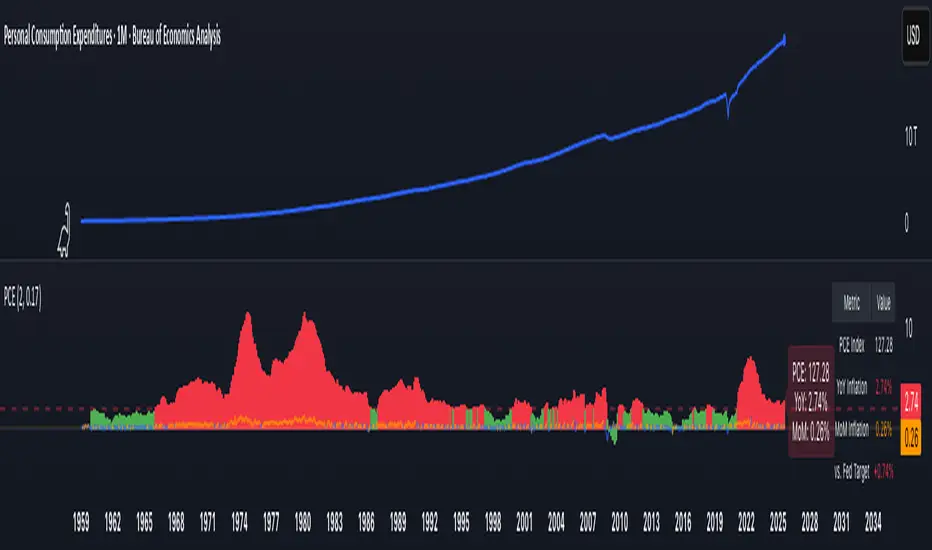
📊 PCE Inflation Monitor - The Fed's Most Important Metric
Personal Consumption Expenditures (PCE) is the Federal Reserve's preferred inflation measure and THE metric they target for their 2% inflation goal. If you want to predict Fed policy, you need to watch PCE.
🎯 KEY FEATURES:
- Dual Perspective Analysis:
- Year-over-Year (YoY): Histogram bars showing annual PCE inflation
- Month-over-Month (MoM): Line overlay showing monthly consumption price changes
- Visual Reference System:
- Dashed line at 2% (Fed's official PCE inflation target)
- Dotted line at 0.17% (equivalent monthly target)
- Color-coded bars: Red above Fed target, Green below target
- Real-Time Data Table:
- Current PCE Index value
- YoY inflation rate vs. Fed's 2% target
- MoM inflation rate with color coding
- Exact deviation from Fed target (critical for policy predictions)
- Automated Alerts:
- PCE crosses Fed's 2% target (major policy signal!)
- MoM crosses monthly target
- Stay informed of Fed-relevant inflation changes
📈 WHY PCE IS DIFFERENT (AND MORE IMPORTANT):
PCE vs. CPI differences:
- Flexible basket: PCE adjusts for substitution (beef → chicken if prices rise)
- Broader coverage: Includes healthcare paid by insurance/government
- Lower readings: Typically 0.2-0.4% below CPI
- Fed's choice: Explicitly stated as their target metric
Most importantly: When Powell speaks about "our 2% target," he means PCE, not CPI!
🔍 TRADING IMPLICATIONS:
PCE Above 2% (Red Zone):
→ Fed under pressure to maintain/raise rates
→ Hawkish policy stance likely
→ Negative for growth stocks, crypto
→ Positive for USD, bearish for gold
PCE Below 2% (Green Zone):
→ Fed has flexibility to cut rates
→ Dovish policy stance possible
→ Positive for risk assets, growth stocks
→ Negative for USD, bullish for commodities
PCE Approaching 2% from Above:
→ Fed "mission accomplished" narrative
→ Rate cut cycle becomes possible
→ Major bullish signal for equities/crypto
💡 ADVANCED STRATEGIES:
1. Fed Meeting Preparation: Check PCE before FOMC meetings for policy clues
2. Dot Plot Predictions: PCE trend determines Fed's rate forecast updates
3. Pivot Timing: When PCE MoM turns negative, Fed pivot becomes realistic
4. Press Conference Analysis: Compare Powell's comments to PCE deviation
🎯 KEY LEVELS TO WATCH:
- 2.0% YoY: Fed's official target - crossing this level is major news
- 2.5% YoY: "Uncomfortably high" - Fed forced to stay restrictive
- 3.0% YoY: "Crisis mode" - Fed turns very hawkish
- 1.5% YoY: "Below target" - Rate cuts become likely
🔄 COMBINE WITH:
- CPI: Public perception vs. Fed's metric (often diverge)
- Core PCE: Even more important (excludes food/energy volatility)
- Fed Funds Rate: Is Fed responding appropriately to PCE?
📊 DATA SOURCE:
Official PCE data from FRED (Federal Reserve Economic Data), updated monthly typically in the last week of each month (after CPI/PPI releases).
🎨 CUSTOMIZATION:
Fully customizable:
- Toggle YoY/MoM displays
- Adjust Fed target if needed
- Customize colors
- Show/hide absolute PCE values
Perfect for: Fed watchers, macro traders, policy analysts, and serious investors who want to predict monetary policy changes before they happen.
⚠️ CRITICAL INSIGHT: While media focuses on CPI, the Fed focuses on PCE. Trade what the Fed trades, not what the headlines say.
🎓 Pro Tip: Fed members often mention "Core PCE" (excluding food/energy). Consider adding that indicator alongside this one for complete Fed policy analysis.
Script de código aberto
Em verdadeiro espírito do TradingView, o criador deste script o tornou de código aberto, para que os traders possam revisar e verificar sua funcionalidade. Parabéns ao autor! Embora você possa usá-lo gratuitamente, lembre-se de que a republicação do código está sujeita às nossas Regras da Casa.
Aviso legal
As informações e publicações não se destinam a ser, e não constituem, conselhos ou recomendações financeiras, de investimento, comerciais ou de outro tipo fornecidos ou endossados pela TradingView. Leia mais nos Termos de Uso.