OPEN-SOURCE SCRIPT
RSI XTR with selective candle color by Edwin K
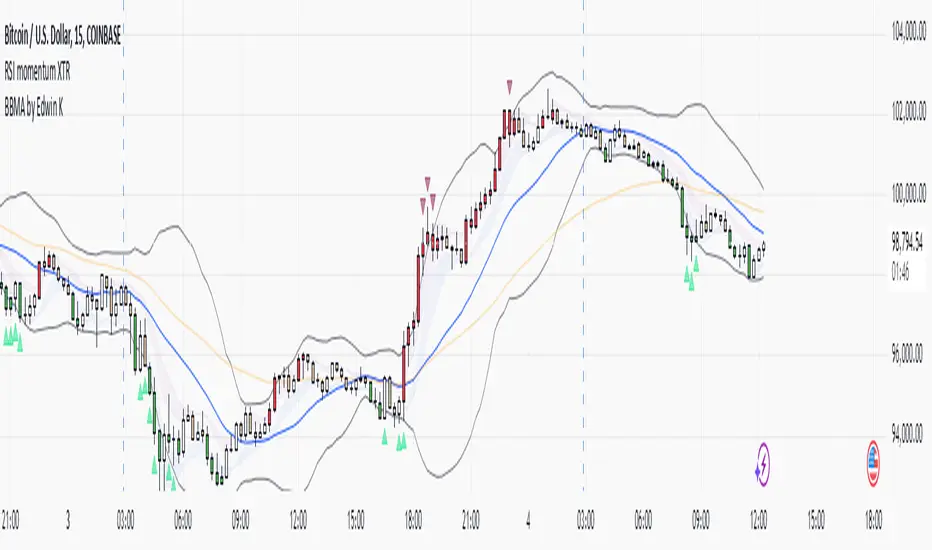
This tradingView indicator named "RSI XTR with selective candle color", which modifies the candle colors on the chart based on RSI (Relative Strength Index) conditions. Here's how it works:
- rsiPeriod: Defines the RSI calculation period (default = 5).
- rsiOverbought: RSI level considered overbought (default = 70).
- rsiOversold: RSI level considered oversold (default = 30).
- These values can be modified by the user in the settings.
RSI Calculation
- Computes the RSI value using the ta.rsi() function on the closing price (close).
- The RSI is a momentum indicator that measures the magnitude of recent price changes.
Conditions for Candle Coloring
- when the RSI is above the overbought level.
- when the RSI is below the oversold level.
How It Works in Practice
- When the RSI is above 70 (overbought) → Candles turn red.
- When the RSI is below 30 (oversold) → Candles turn green.
- If the RSI is between 30 and 70, the candle keeps its default color.
This helps traders quickly spot potential reversal zones based on RSI momentum.
Script de código aberto
Em verdadeiro espírito do TradingView, o criador deste script o tornou de código aberto, para que os traders possam revisar e verificar sua funcionalidade. Parabéns ao autor! Embora você possa usá-lo gratuitamente, lembre-se de que a republicação do código está sujeita às nossas Regras da Casa.
Aviso legal
As informações e publicações não se destinam a ser, e não constituem, conselhos ou recomendações financeiras, de investimento, comerciais ou de outro tipo fornecidos ou endossados pela TradingView. Leia mais nos Termos de Uso.