OPEN-SOURCE SCRIPT
Atualizado Momentum RSI
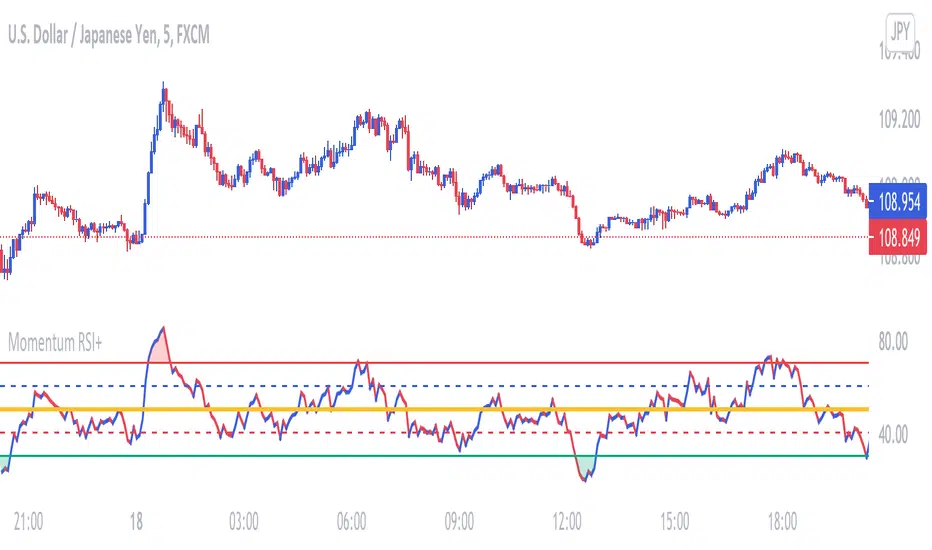
This RSI is used to determine price Momentum and Overbought or Oversold Market conditions. When the RSI is between 50% and 70% price is considered to have upward momentum. When The RSI is between 50% and 30% price is considered to have downward momentum. When the RSI is between 40% and 60% price is considered to have no directional momentum and is considered to be in consolidation. When the RSI is above 70% price is to be considered Overbought. When the RSI is bellow 30% price is to be considered Oversold
Notas de Lançamento
Renamed Hlines and changed standard colorNotas de Lançamento
Style updateNotas de Lançamento
RSI Line color update to show momentumAdded Green shade when RSI is Overbought and Red shade when RSI is Oversold
Script de código aberto
No verdadeiro espirito do TradingView, o autor desse script o publicou como código aberto, para que os traders possam entendê-lo e verificá-lo. Parabéns ao autor Você pode usá-lo gratuitamente, mas a reutilização desse código em publicações e regida pelas Regras da Casa.
Aviso legal
As informações e publicações não devem ser e não constituem conselhos ou recomendações financeiras, de investimento, de negociação ou de qualquer outro tipo, fornecidas ou endossadas pela TradingView. Leia mais em Termos de uso.