OPEN-SOURCE SCRIPT
HTF Support & Resistance [QuantVue]
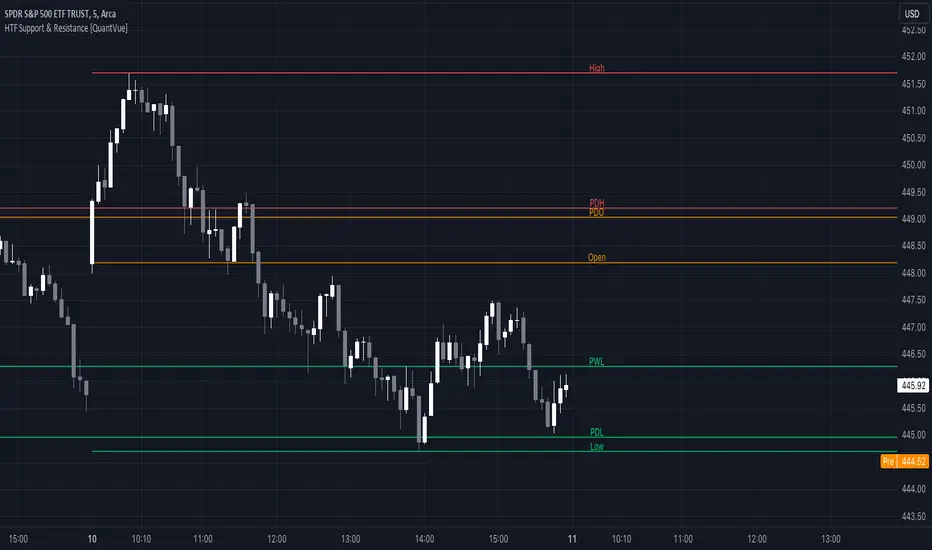
The "HTF Support / Resistance" indicator highlights critical price levels across multiple timeframes helping you recognize major support/resistance areas.
Whether you're a day trader needing to understand the current day's price action, or a long-term investor looking to analyze yearly trends, this indicator can be a valuable addition to your trading toolkit.
The daily levels, which can be enabled or disabled according to your preference, will give you insights into the open, high, and low levels for the current and previous day.
Similarly, weekly levels provide information for the current and previous weeks, while monthly levels cover the current and previous months.
In addition, the indicator offers more extended views through its quarterly and yearly levels. These will help you understand long-term trends and major support/resistance areas, and they can be particularly beneficial for major support/resistance levels.
Features:
🔹Visualization: View support and resistance levels from Daily, Weekly, Monthly, Quarterly, and Yearly timeframes.
🔹Customizable Appearance: Tailor the display colors and line styles for each level according to your preferences.
🔹Clear Labeling: Each level is clearly labeled for quick identification.
🔹Extension Option: Opt to extend the support and resistance lines across the chart for better visualization.
Give this indicator a BOOST and COMMENT your thoughts!
We hope you enjoy.
Cheers.
Script de código aberto
Em verdadeiro espírito do TradingView, o criador deste script o tornou de código aberto, para que os traders possam revisar e verificar sua funcionalidade. Parabéns ao autor! Embora você possa usá-lo gratuitamente, lembre-se de que a republicação do código está sujeita às nossas Regras da Casa.
Get Access to the exclusive QuantVue indicators: quantvue.io/
Join thousands of traders in our Free Discord: discord.gg/tC7u7magU3
Join thousands of traders in our Free Discord: discord.gg/tC7u7magU3
Aviso legal
As informações e publicações não se destinam a ser, e não constituem, conselhos ou recomendações financeiras, de investimento, comerciais ou de outro tipo fornecidos ou endossados pela TradingView. Leia mais nos Termos de Uso.