PROTECTED SOURCE SCRIPT
Atualizado multi RSI channel for divergence / wave analysis

This is an indicator that will make analysis using RSI much easier!
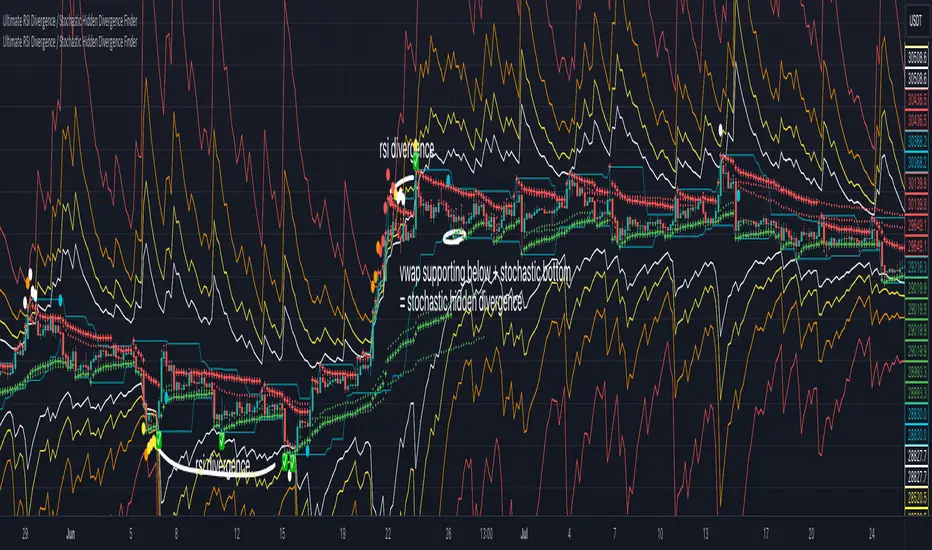
This indicator is basically an RSI, that uses the concept of bollingerbands, and draws channel that corresponds with the real RSI value.
With this script, you will be able to
1.spot divergences visually, and much easier (rsi channel is set to 35/65-white 30/70-yellow 20/80-orange 15/85-red)
2.analyze the wave easier with the guidance of labels printed
For those people who use RSI alot, you will be able to use this indicator for spotting divergence scenarios before the divergence forms,
and with the multi-rsi channel & help of label, you will be able to visually know that the divergence has formed.
this indicator will help guide you to read RSI indicator much better, and I personally don't think that you need extra RSI indicator(default),
because this is much more intuitive, and you get all the benefits of RSI as well.
hope this helps someone like me who really wanted to use RSI channel more professionally!
Notas de Lançamento
도형님 코드 수정본Notas de Lançamento
the best divergence indicator IMO.Regular divergence uses rsi 11 period, and each level is defined as
75, 80, 85, 90 (white,yellow,orange,red)
aqua circle is there to remind you that it has made enough pullback for divergence to be strong enough.
I recommend at least rsi of 85 or more for the highest RSI value (orange) and then create a regular divergence (green checkbox)
for hidden divergence, I think that stochastic indicator does the trick, and basically stochastic indicator is the same concept as donchian channel, so I'm using donchian channel as well as vwap in order to figure out if there exist a supporting vwap and the price touching the donchian channel. this means that there exist hidden divergence, and the quality is decided by the supporting vwap and overall structure of the price.
Script protegido
Esse script é publicada como código fechado. No entanto, você pode gerenciar suas escolhas de bate-papo. Por favor, abra suas Configurações do perfil
Aviso legal
As informações e publicações não se destinam a ser, e não constituem, conselhos ou recomendações financeiras, de investimento, comerciais ou de outro tipo fornecidos ou endossados pela TradingView. Leia mais nos Termos de Uso.