OPEN-SOURCE SCRIPT
Atualizado [blackcat] L2 Ehlers Hurst Coefficient Indicator
Level: 2
Background
John F. Ehlers introuced Hurst Coefficient Indicator in his "Cycle Analytics for Traders" chapter 6 on 2013.
Function
The Hurst coefficient is one way to attempt to get a handle on the slope of the power density of market data. The Hurst coefficient varies between 0 and 1, and is related to the α power coefficient as H = 1 − α/2. The Hurst coefficient is more estimated than computed. Dr. Ehlers found the estimate using the fractal dimension was the most practical for shorter-term market data. The Hurst coefficient is related to the fractal dimension as H = 2 − D. Dr. Ehlers would like to make it perfectly clear that the Hurst coefficient or the fractal dimension has no direct practical application to trading not only because it is an estimate, but also because it has no predictive value. These computations only reflect the general structure of the market, and the answer you get is dependent on your assumptions. For example, the Hurst coefficient changes dramatically with the length of data used in making the estimate.
The only user input is the length of data to be used. The number can be arbitrarily large if you have sufficient data. The results are critically dependent on the input data length selected. After declaring variables, the coefficients of a 20-bar SuperSmoother filter are computed. The computations of N1, N2, and N3 are as described in the previous section. The fractal dimension is then converted to the Hurst coefficient, which is subsequently smoothed in the SuperSmoother filter.
Key Signal
SmoothHurst --> Hurst Coefficient Indicator fast line
Trigger --> Hurst Coefficient Indicator slow line
Pros and Cons
100% John F. Ehlers definition translation of original work, even variable names are the same. This help readers who would like to use pine to read his book. If you had read his works, then you will be quite familiar with my code style.
Remarks
The 40th script for Blackcat1402 John F. Ehlers Week publication.
Readme
In real life, I am a prolific inventor. I have successfully applied for more than 60 international and regional patents in the past 12 years. But in the past two years or so, I have tried to transfer my creativity to the development of trading strategies. Tradingview is the ideal platform for me. I am selecting and contributing some of the hundreds of scripts to publish in Tradingview community. Welcome everyone to interact with me to discuss these interesting pine scripts.
The scripts posted are categorized into 5 levels according to my efforts or manhours put into these works.
Level 1 : interesting script snippets or distinctive improvement from classic indicators or strategy. Level 1 scripts can usually appear in more complex indicators as a function module or element.
Level 2 : composite indicator/strategy. By selecting or combining several independent or dependent functions or sub indicators in proper way, the composite script exhibits a resonance phenomenon which can filter out noise or fake trading signal to enhance trading confidence level.
Level 3 : comprehensive indicator/strategy. They are simple trading systems based on my strategies. They are commonly containing several or all of entry signal, close signal, stop loss, take profit, re-entry, risk management, and position sizing techniques. Even some interesting fundamental and mass psychological aspects are incorporated.
Level 4 : script snippets or functions that do not disclose source code. Interesting element that can reveal market laws and work as raw material for indicators and strategies. If you find Level 1~2 scripts are helpful, Level 4 is a private version that took me far more efforts to develop.
Level 5 : indicator/strategy that do not disclose source code. private version of Level 3 script with my accumulated script processing skills or a large number of custom functions. I had a private function library built in past two years. Level 5 scripts use many of them to achieve private trading strategy.
Notas de Lançamento
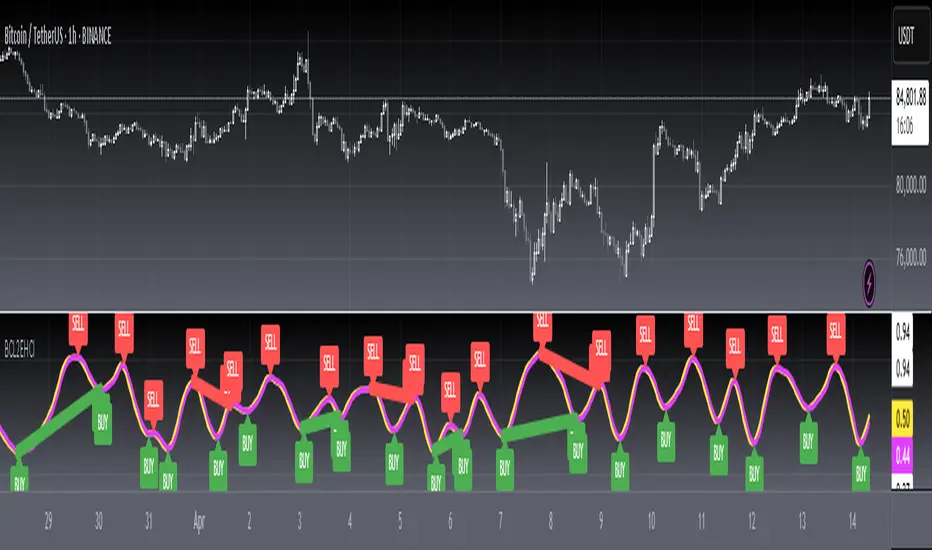
OVERVIEW The L2 Ehlers Hurst Coefficient Indicator is an advanced technical analysis tool that measures market efficiency and trend persistence using the Hurst exponent. It combines cycle analysis with divergence detection to identify potential market turning points.FEATURES
• Customizable length parameter (default: 30)
• Super Smoother Filter integration
• Visual representation of Hurst coefficient and trigger line
• Four types of divergence detection:
Regular Bullish
Hidden Bullish
Regular Bearish
Hidden Bearish • Configurable lookback periods and range settings • Alert conditions for all divergence types
HOW TO USE
Adjust the Length input to match market conditions
Monitor the SmoothHurst line relative to the Trigger line
Watch for crossover signals (BUY/SELL labels)
Use divergence alerts to confirm trading opportunities: • Configure lookback periods (Left/Right) • Set range limits (Min/Max) • Enable/disable specific divergence types
LIMITATIONS
• Results depend on proper parameter configuration
• May produce false signals during non-trending markets
• Best used in conjunction with other analysis tools
NOTES
• The indicator overlays the main chart by default
• Color coding helps distinguish between bullish (green) and bearish (red) signals
• Alerts can be customized through TradingView's alert system
Script de código aberto
Em verdadeiro espírito do TradingView, o criador deste script o tornou de código aberto, para que os traders possam revisar e verificar sua funcionalidade. Parabéns ao autor! Embora você possa usá-lo gratuitamente, lembre-se de que a republicação do código está sujeita às nossas Regras da Casa.
Avoid losing contact!Don't miss out! The first and most important thing to do is to join my Discord chat now! Click here to start your adventure: discord.com/invite/ZTGpQJq 防止失联,请立即行动,加入本猫聊天群: discord.com/invite/ZTGpQJq
Aviso legal
As informações e publicações não se destinam a ser, e não constituem, conselhos ou recomendações financeiras, de investimento, comerciais ou de outro tipo fornecidos ou endossados pela TradingView. Leia mais nos Termos de Uso.