OPEN-SOURCE SCRIPT
Candle Strength
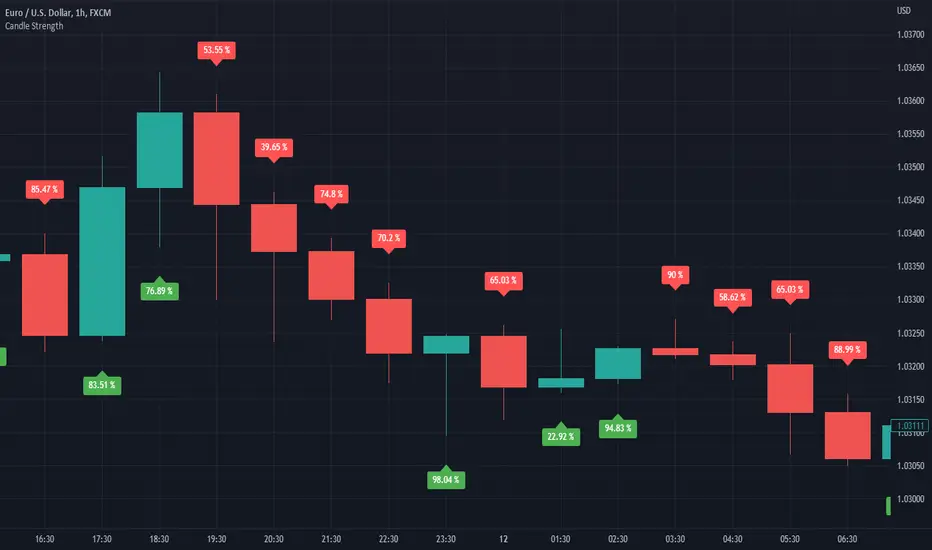
It is hard to know which party plays a vital role in the candle. Sometimes we see a red candle/ Seller's candle very weak, but still, the market continues. Here, I tried to figure out how much strength buyers/sellers possess in their respective candles.
The idea is simply to measure the area between high and low and then calculate the opposite party's oppression by calculating the wick's area.
This script is more like a tool, and hence I do not suggest using this as an independent strategy. However, combining it with other analyses and strategies will surely bear fruitful results.
I, in the future, will come up with strategies and more tools like this.
So, follow me to keep getting updates.
Thanks.
Script de código aberto
Em verdadeiro espírito do TradingView, o criador deste script o tornou de código aberto, para que os traders possam revisar e verificar sua funcionalidade. Parabéns ao autor! Embora você possa usá-lo gratuitamente, lembre-se de que a republicação do código está sujeita às nossas Regras da Casa.
Aviso legal
As informações e publicações não se destinam a ser, e não constituem, conselhos ou recomendações financeiras, de investimento, comerciais ou de outro tipo fornecidos ou endossados pela TradingView. Leia mais nos Termos de Uso.