OPEN-SOURCE SCRIPT
Historical Average
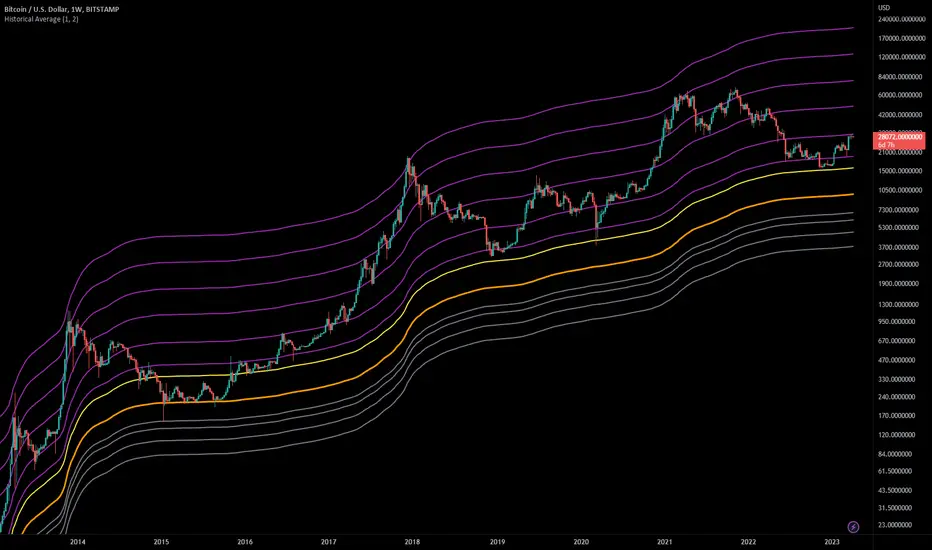
This indicator calculates the sum of all past candles for each new candle.
For the second candle of the chart, the indicator shows the average of the first two candles. For the 10th candle, it's the average of the last ten candles.
Simple Moving Averages (SMAa) calculate the average of a specific timeframe (e.g. SMA200 for the last 200 candles). The historical moving average is an SMA 2 at the second candle, an SMA3 for the third candle, an SMA10 for the tenth, an SMA200 for the 200th candle etc.
Settings:
This indicator works best on charts with a lot of historical data.
Recommended charts:
But you can use it e.g. on DJI or any other chart as well.
For the second candle of the chart, the indicator shows the average of the first two candles. For the 10th candle, it's the average of the last ten candles.
Simple Moving Averages (SMAa) calculate the average of a specific timeframe (e.g. SMA200 for the last 200 candles). The historical moving average is an SMA 2 at the second candle, an SMA3 for the third candle, an SMA10 for the tenth, an SMA200 for the 200th candle etc.
Settings:
- You can set the multiplier to move the Historical Moving Average along the price axis.
- You can show two Historical Moving Averages with different multipliers.
- You can add fibonacci multipliers to the Historical Moving Average.
This indicator works best on charts with a lot of historical data.
Recommended charts:
- INDEX:BTCUSD
- BLX
But you can use it e.g. on DJI or any other chart as well.
Script de código aberto
Em verdadeiro espírito do TradingView, o criador deste script o tornou de código aberto, para que os traders possam revisar e verificar sua funcionalidade. Parabéns ao autor! Embora você possa usá-lo gratuitamente, lembre-se de que a republicação do código está sujeita às nossas Regras da Casa.
We build Bitcoin and crypto algorithms with the intention to outperform.
Check out our website to see more of our work.
Check out our website to see more of our work.
Aviso legal
As informações e publicações não se destinam a ser, e não constituem, conselhos ou recomendações financeiras, de investimento, comerciais ou de outro tipo fornecidos ou endossados pela TradingView. Leia mais nos Termos de Uso.