PROTECTED SOURCE SCRIPT
Kitaec MADIV2 (MAp of DIVergences part 2)
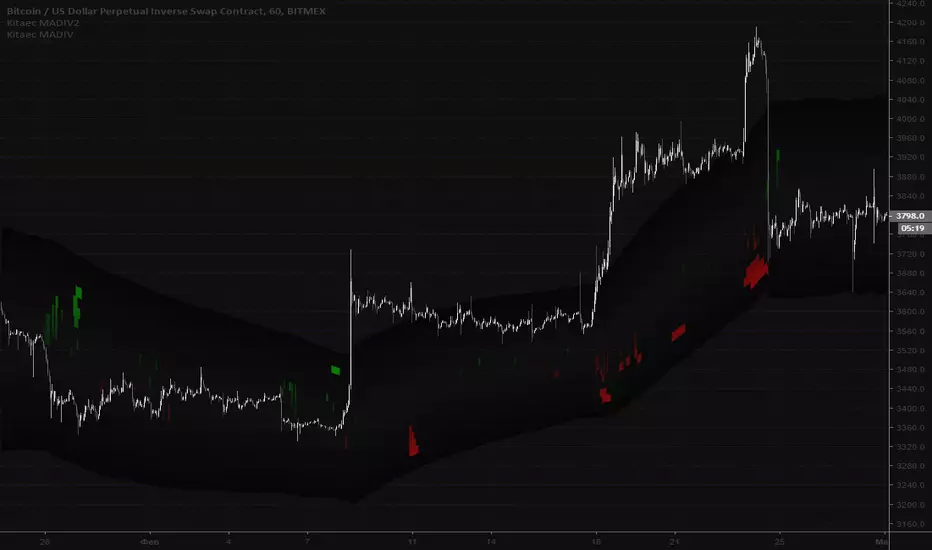
Map of RSI divergences part two. Must be used with MADIV (its a part 1 of this script). Showing Bullish and bearish divergences from different timeframes on the chart. Timeframes for full script are: 5m-15m-30m-1h-2h-4h-6h-8h-12h-1d. This part is from 4h to 1d. Second part is 5m to 2h.
Script protegido
Esse script é publicada como código fechado. No entanto, você pode gerenciar suas escolhas de bate-papo. Por favor, abra suas Configurações do perfil
Aviso legal
The information and publications are not meant to be, and do not constitute, financial, investment, trading, or other types of advice or recommendations supplied or endorsed by TradingView. Read more in the Terms of Use.