OPEN-SOURCE SCRIPT
Top 40 constituents of S&P 500 Index
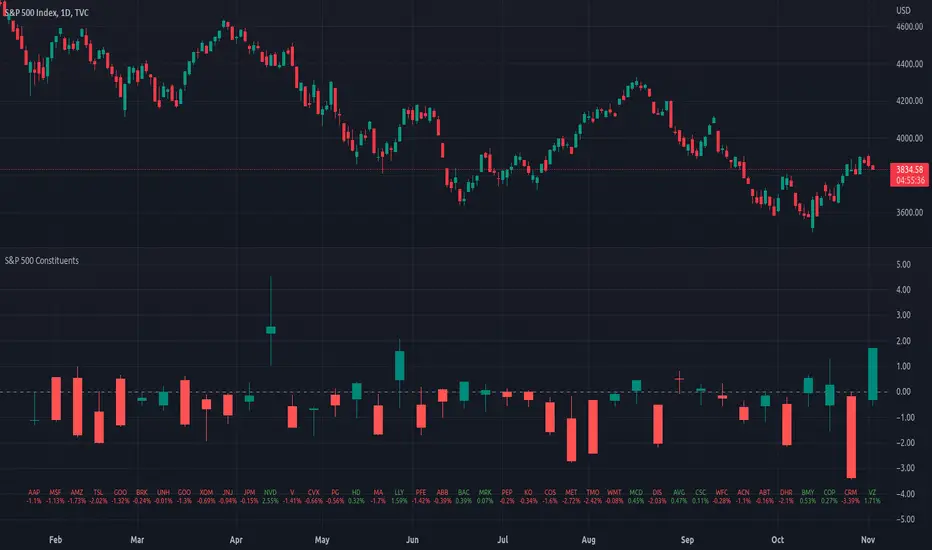
Displays real-time candles of top 40 constituents of S&P 500 Index ( SPX) for a given time frame, side-by-side. This gives an overall idea of breadth and depth of market movements in the time-frame.
Please note that, this is not a standard chart rendered bar-wise and may take time to load as it requests multiple securities. You could modify the contents, from settings, to include stocks from your portfolio or indices of different sectors.
Please note that, this is not a standard chart rendered bar-wise and may take time to load as it requests multiple securities. You could modify the contents, from settings, to include stocks from your portfolio or indices of different sectors.
Script de código aberto
No verdadeiro espirito do TradingView, o autor desse script o publicou como código aberto, para que os traders possam entendê-lo e verificá-lo. Parabéns ao autor Você pode usá-lo gratuitamente, mas a reutilização desse código em publicações e regida pelas Regras da Casa.
Aviso legal
As informações e publicações não devem ser e não constituem conselhos ou recomendações financeiras, de investimento, de negociação ou de qualquer outro tipo, fornecidas ou endossadas pela TradingView. Leia mais em Termos de uso.