OPEN-SOURCE SCRIPT
MT-RSI
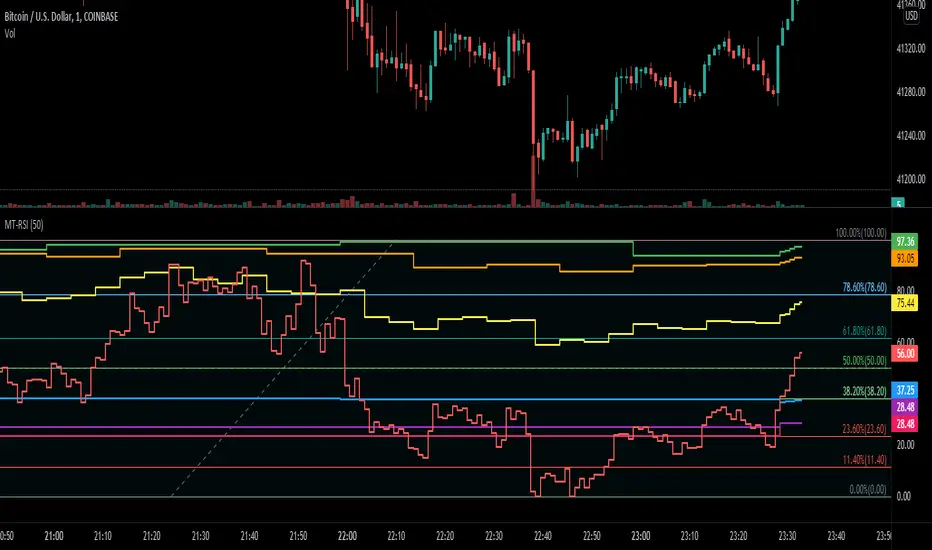
This script shows a "Multi Timeframe RSI" for a range. You could use this script to quickly detect if the RSI of the higher and lower timeframes are overbought or oversold.
RSI is relative to a lower timeframe. So 1H is relative to the 4H and the 4H relative to the 1D chart etc...
In this example you can see that the 1H timeframe (green line) is performing well but is in overbought territory, but the 4H timeframe (blue line) dit not perform that great relative to the 1H timeframe.
Script de código aberto
Em verdadeiro espírito do TradingView, o criador deste script o tornou de código aberto, para que os traders possam revisar e verificar sua funcionalidade. Parabéns ao autor! Embora você possa usá-lo gratuitamente, lembre-se de que a republicação do código está sujeita às nossas Regras da Casa.
Aviso legal
As informações e publicações não se destinam a ser, e não constituem, conselhos ou recomendações financeiras, de investimento, comerciais ou de outro tipo fornecidos ou endossados pela TradingView. Leia mais nos Termos de Uso.