PROTECTED SOURCE SCRIPT
Atualizado Configurable Yield Curve
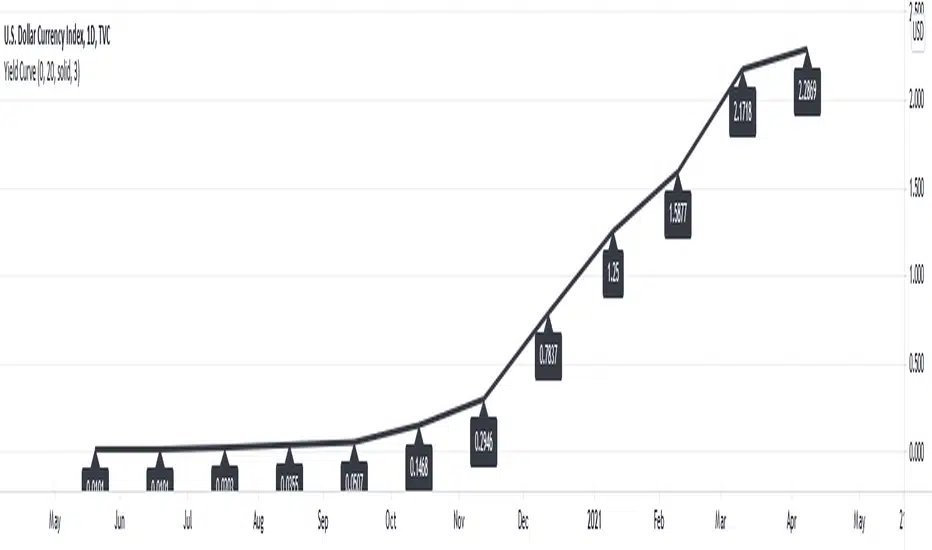
This script draws the US Yield Curve (one month to 30 years). It can be configured to show earlier values using the "Yield values from x bars before" parameter. A value of five and chart time zone "1 day" will show the Yield Curve as it was five days ago. In addition, style settings of the Yield Curve line and the labels can be configured. The drawing engine is also optimized to reduce local and server-side computations.
Notas de Lançamento
Added configuration options to include/exclude segments of the yield curve.Script protegido
Esse script é publicada como código fechado. No entanto, você pode gerenciar suas escolhas de bate-papo. Por favor, abra suas Configurações do perfil
Aviso legal
As informações e publicações não se destinam a ser, e não constituem, conselhos ou recomendações financeiras, de investimento, comerciais ou de outro tipo fornecidos ou endossados pela TradingView. Leia mais nos Termos de Uso.
Script protegido
Esse script é publicada como código fechado. No entanto, você pode gerenciar suas escolhas de bate-papo. Por favor, abra suas Configurações do perfil
Aviso legal
As informações e publicações não se destinam a ser, e não constituem, conselhos ou recomendações financeiras, de investimento, comerciais ou de outro tipo fornecidos ou endossados pela TradingView. Leia mais nos Termos de Uso.