OPEN-SOURCE SCRIPT
Atualizado Order Block plus
Indicator Description: “Order Block Plus”
This indicator is designed for traders who aim to identify the strength and position of supply and demand zones on the chart and receive key signals for entry or exit. Below is a detailed explanation of its functionality:
Features and Applications:
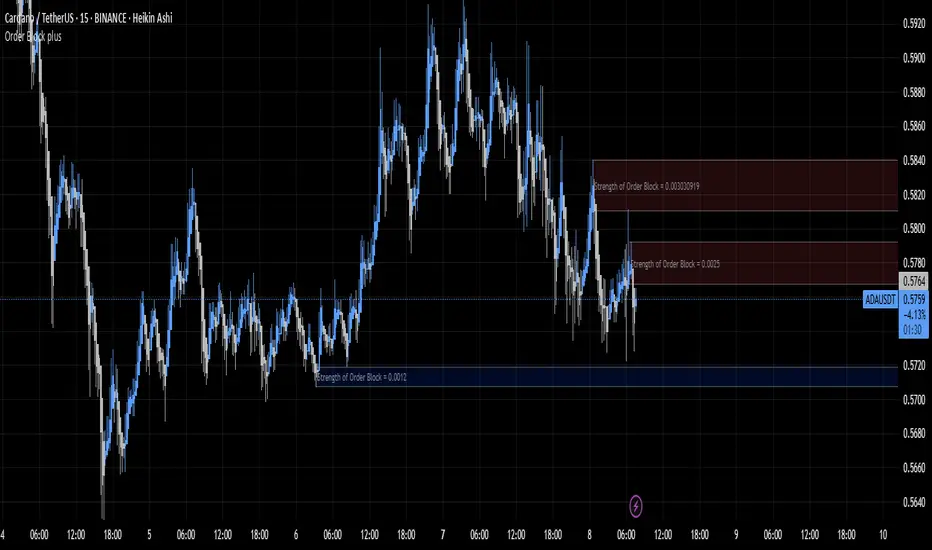
1. Identifying Supply and Demand Zones:
• Supply (Resistance) and Demand (Support) zones are visually displayed on the chart.
• Each zone is marked with a specific color (Yellow for supply, Blue for demand) for easy identification.
2. Breakout and Reversal Signals:
• The indicator detects Breakout and Reversal patterns and highlights them with alerts.
• Example: Detecting price breaking above or below key levels.
3. Candlestick Pattern Support:
• Identifies powerful patterns such as Bullish Engulf, Bearish Engulf, Three White Soldiers, and Three Black Crows.
4. Displaying Zone Strength:
• The indicator shows the strength of supply and demand zones using text displayed inside each zone.
5. Alerts:
• Provides alerts for zone breakouts, breakdowns, and new zone formations.
• Example: Alerts for breaking a demand or supply zone.
How to Use:
1. Adding to the Chart:
• The indicator can be applied to any time frame and is suitable for Forex, stocks, or cryptocurrency charts.
2. Identifying Trading Opportunities:
• Demand zones indicate strong support levels where prices are likely to rise.
• Supply zones indicate resistance levels where prices are likely to fall.
3. Examining Zone Strength:
• The strength of each zone is displayed with text inside the zone.
Indicator Settings:
• Zone Colors:
• The default colors for supply and demand zones are yellow and blue, but they can be customized.
• Alerts:
• Configurable alerts for breakouts or reversals.
Advantages:
• Automatic detection of key price levels.
• Accurate and timely alerts for trades.
• Customizable for professional traders.
Note: This indicator is designed for technical analysis and should be used alongside a suitable trading strategy.
This indicator is designed for traders who aim to identify the strength and position of supply and demand zones on the chart and receive key signals for entry or exit. Below is a detailed explanation of its functionality:
Features and Applications:
1. Identifying Supply and Demand Zones:
• Supply (Resistance) and Demand (Support) zones are visually displayed on the chart.
• Each zone is marked with a specific color (Yellow for supply, Blue for demand) for easy identification.
2. Breakout and Reversal Signals:
• The indicator detects Breakout and Reversal patterns and highlights them with alerts.
• Example: Detecting price breaking above or below key levels.
3. Candlestick Pattern Support:
• Identifies powerful patterns such as Bullish Engulf, Bearish Engulf, Three White Soldiers, and Three Black Crows.
4. Displaying Zone Strength:
• The indicator shows the strength of supply and demand zones using text displayed inside each zone.
5. Alerts:
• Provides alerts for zone breakouts, breakdowns, and new zone formations.
• Example: Alerts for breaking a demand or supply zone.
How to Use:
1. Adding to the Chart:
• The indicator can be applied to any time frame and is suitable for Forex, stocks, or cryptocurrency charts.
2. Identifying Trading Opportunities:
• Demand zones indicate strong support levels where prices are likely to rise.
• Supply zones indicate resistance levels where prices are likely to fall.
3. Examining Zone Strength:
• The strength of each zone is displayed with text inside the zone.
Indicator Settings:
• Zone Colors:
• The default colors for supply and demand zones are yellow and blue, but they can be customized.
• Alerts:
• Configurable alerts for breakouts or reversals.
Advantages:
• Automatic detection of key price levels.
• Accurate and timely alerts for trades.
• Customizable for professional traders.
Note: This indicator is designed for technical analysis and should be used alongside a suitable trading strategy.
Notas de Lançamento
Indicator Description: “Order Block Plus”This indicator is designed for traders who aim to identify the strength and position of supply and demand zones on the chart and receive key signals for entry or exit. Below is a detailed explanation of its functionality:
Features and Applications:
1. Identifying Supply and Demand Zones:
• Supply (Resistance) and Demand (Support) zones are visually displayed on the chart.
• Each zone is marked with a specific color (Yellow for supply, Blue for demand) for easy identification.
2. Breakout and Reversal Signals:
• The indicator detects Breakout and Reversal patterns and highlights them with alerts.
• Example: Detecting price breaking above or below key levels.
3. Candlestick Pattern Support:
• Identifies powerful patterns such as Bullish Engulf, Bearish Engulf, Three White Soldiers, and Three Black Crows.
4. Displaying Zone Strength:
• The indicator shows the strength of supply and demand zones using text displayed inside each zone.
5. Alerts:
• Provides alerts for zone breakouts, breakdowns, and new zone formations.
• Example: Alerts for breaking a demand or supply zone.
How to Use:
1. Adding to the Chart:
• The indicator can be applied to any time frame and is suitable for Forex, stocks, or cryptocurrency charts.
2. Identifying Trading Opportunities:
• Demand zones indicate strong support levels where prices are likely to rise.
• Supply zones indicate resistance levels where prices are likely to fall.
3. Examining Zone Strength:
• The strength of each zone is displayed with text inside the zone.
Indicator Settings:
• Zone Colors:
• The default colors for supply and demand zones are yellow and blue, but they can be customized.
• Alerts:
• Configurable alerts for breakouts or reversals.
Advantages:
• Automatic detection of key price levels.
• Accurate and timely alerts for trades.
• Customizable for professional traders.
Note: This indicator is designed for technical analysis and should be used alongside a suitable trading strategy.
Notas de Lançamento
“Minor visual update: Changed the color scheme of the Order Block boxes for better clarity.”Script de código aberto
Em verdadeiro espírito do TradingView, o criador deste script o tornou de código aberto, para que os traders possam revisar e verificar sua funcionalidade. Parabéns ao autor! Embora você possa usá-lo gratuitamente, lembre-se de que a republicação do código está sujeita às nossas Regras da Casa.
Aviso legal
As informações e publicações não se destinam a ser, e não constituem, conselhos ou recomendações financeiras, de investimento, comerciais ou de outro tipo fornecidos ou endossados pela TradingView. Leia mais nos Termos de Uso.
Script de código aberto
Em verdadeiro espírito do TradingView, o criador deste script o tornou de código aberto, para que os traders possam revisar e verificar sua funcionalidade. Parabéns ao autor! Embora você possa usá-lo gratuitamente, lembre-se de que a republicação do código está sujeita às nossas Regras da Casa.
Aviso legal
As informações e publicações não se destinam a ser, e não constituem, conselhos ou recomendações financeiras, de investimento, comerciais ou de outro tipo fornecidos ou endossados pela TradingView. Leia mais nos Termos de Uso.