OPEN-SOURCE SCRIPT
Atualizado Bogdan Ciocoiu - Looking Glass

► Description
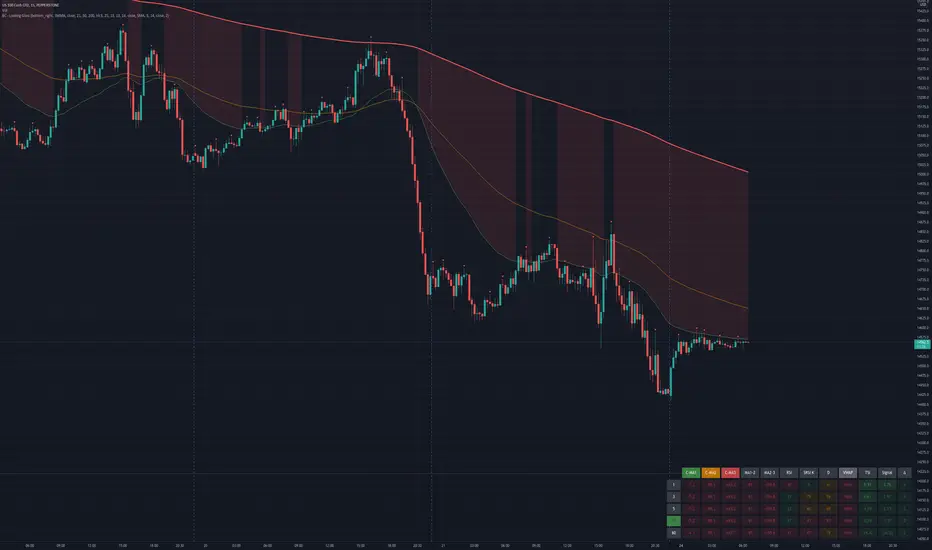
The script shows a multi-timeline suite of information for the current ticker. This information refers to configurable moving averages, RSI, Stochastic RSI, VWAP and TSI data. The timeframes reflected in the script vary from 1m to 1h. I recommend the tool for 3m scalping as it provides good visibility upwards.
The headings from the table are:
► Originality and usefulness
This tool is helpful because it helps users read a chart much quicker than if they were to navigate between timeframes. The colour coding indicates an accident/descendant trend between any two values (i.e. close vs MA1, MA1-MA2, RSI K vs RSI D, etc.).
► Open-source reuse
tradingview.com/support/solutions/43000502589-moving-average/
tradingview.com/support/solutions/43000502338-relative-strength-index-rsi/
tradingview.com/support/solutions/43000502333-stochastic-rsi-stoch-rsi/
tradingview.com/support/solutions/43000502018-volume-weighted-average-price-vwap/
tradingview.com/support/solutions/43000592290-true-strength-indicator/
The script shows a multi-timeline suite of information for the current ticker. This information refers to configurable moving averages, RSI, Stochastic RSI, VWAP and TSI data. The timeframes reflected in the script vary from 1m to 1h. I recommend the tool for 3m scalping as it provides good visibility upwards.
The headings from the table are:
- {Close} - {MA1}
- {Close} - {MA2}
- {Close} - {MA3}
- {MA1} - {MA2}
- {MA2} - {MA3}
- {RSI}
- {Stoch RSI K}
- {Stoch RSI D}
- {VWAP}
- {TSI}
- {TSI EMA}
- {TSI} - {TSI EMA}
► Originality and usefulness
This tool is helpful because it helps users read a chart much quicker than if they were to navigate between timeframes. The colour coding indicates an accident/descendant trend between any two values (i.e. close vs MA1, MA1-MA2, RSI K vs RSI D, etc.).
► Open-source reuse
tradingview.com/support/solutions/43000502589-moving-average/
tradingview.com/support/solutions/43000502338-relative-strength-index-rsi/
tradingview.com/support/solutions/43000502333-stochastic-rsi-stoch-rsi/
tradingview.com/support/solutions/43000502018-volume-weighted-average-price-vwap/
tradingview.com/support/solutions/43000592290-true-strength-indicator/
Notas de Lançamento
This tool now offers additional features such as managing which columns are being shown, making it more suitable for tablets and devices with limited screen estate.Notas de Lançamento
// Original Description// The script shows a multi-timeline suite of information for the current ticker. This information refers to configurable moving averages, RSI, Stochastic RSI, VWAP and TSI data. The timeframes reflected in the script vary from 1m to 1h. I recommend the tool for 3m scalping as it provides good visibility upwards.
// This is the updated version of the original script. Special thanks to SamAccountX for the support.
// Major updates compared to the v1 version include:
// - Being able to change the style of the lines, including width and colour
// - Being able to show/hide the table or specific columns/rows from within
// - Improvements in terms of naming the plots and shapes to ease traceability and managing settings
// - Optimised the previous revision by reducing the number of "request.security" calls, improving load and allowing room for more feature functionalities.
// - Allows repositioning the table subject to screen size and shape to suit the diverse type of terminals out there
Script de código aberto
Em verdadeiro espírito do TradingView, o criador deste script o tornou de código aberto, para que os traders possam revisar e verificar sua funcionalidade. Parabéns ao autor! Embora você possa usá-lo gratuitamente, lembre-se de que a republicação do código está sujeita às nossas Regras da Casa.
Aviso legal
As informações e publicações não se destinam a ser, e não constituem, conselhos ou recomendações financeiras, de investimento, comerciais ou de outro tipo fornecidos ou endossados pela TradingView. Leia mais nos Termos de Uso.