OPEN-SOURCE SCRIPT
Price–MA Separation (Z-Score)
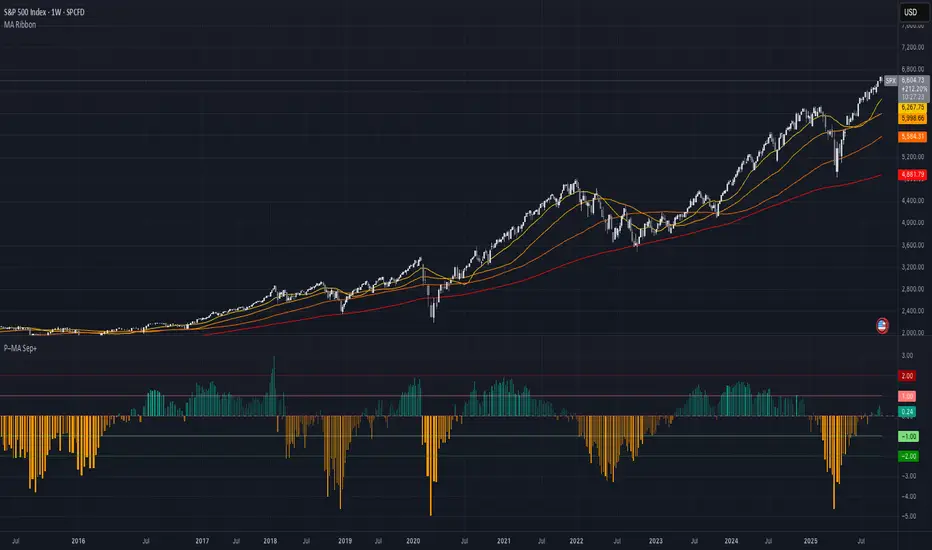
Price–MA Separation (Z-Score + Shading)
This indicator measures how far price is from a chosen moving average and shows it in a separate pane.
It helps traders quickly spot overextended moves and mean-reversion opportunities.
⸻
What it does
• Calculates the separation between price and a moving average (MA):
• In Points (Price − MA)
• In Percent ((Price / MA − 1) × 100%)
• Converts that separation into a Z-Score (statistical measure of deviation):
• Z = (Separation − Mean) ÷ StdDev
• Highlights when price is unusually far from the MA relative to its recent history.
⸻
Visuals
• Histogram bars:
• Green = above the MA,
• Orange = below the MA.
• Intensity increases with larger Z-Scores.
• Zero line: red baseline (price = MA).
• Z threshold lines:
• +T1 = light red (mild overbought)
• +T2 = dark red (strong overbought)
• −T1 = light green (mild oversold)
• −T2 = dark green (strong oversold)
• Default thresholds: ±1 and ±2.
⸻
Settings
• MA Type & Length: Choose between SMA, EMA, WMA, VWMA, or SMMA (RMA).
• Units: Show separation in Points or Percent.
• Plot Mode:
• Raw = distance in points/percent.
• Z-Score = standardized deviation (default).
• Absolute Mode: Show only magnitude (ignore direction).
• Smoothing: Overlay a smoothed line on the histogram.
• Z-Bands: Visual guides at ± thresholds.
⸻
How to use
• Look for large positive Z-Scores (red zones): price may be stretched far above its MA.
• Look for large negative Z-Scores (green zones): price may be stretched far below its MA.
• Use as a mean-reversion signal or to confirm trend exhaustion.
• Works well with:
• Swing entries/exits
• Overbought/oversold conditions
• Filtering other signals (RSI, MACD, VWAP)
⸻
Notes
• Z-Scores depend on the lookback window (default = 100 bars). Adjust for shorter/longer memory.
• Strong deviations don’t always mean reversal—combine with other tools for confirmation.
• Not financial advice. Always manage risk.
⸻
Try adjusting the MA length and Z-Score thresholds to fit your trading style.
Script de código aberto
Em verdadeiro espírito do TradingView, o criador deste script o tornou de código aberto, para que os traders possam revisar e verificar sua funcionalidade. Parabéns ao autor! Embora você possa usá-lo gratuitamente, lembre-se de que a republicação do código está sujeita às nossas Regras da Casa.
Aviso legal
As informações e publicações não se destinam a ser, e não constituem, conselhos ou recomendações financeiras, de investimento, comerciais ou de outro tipo fornecidos ou endossados pela TradingView. Leia mais nos Termos de Uso.