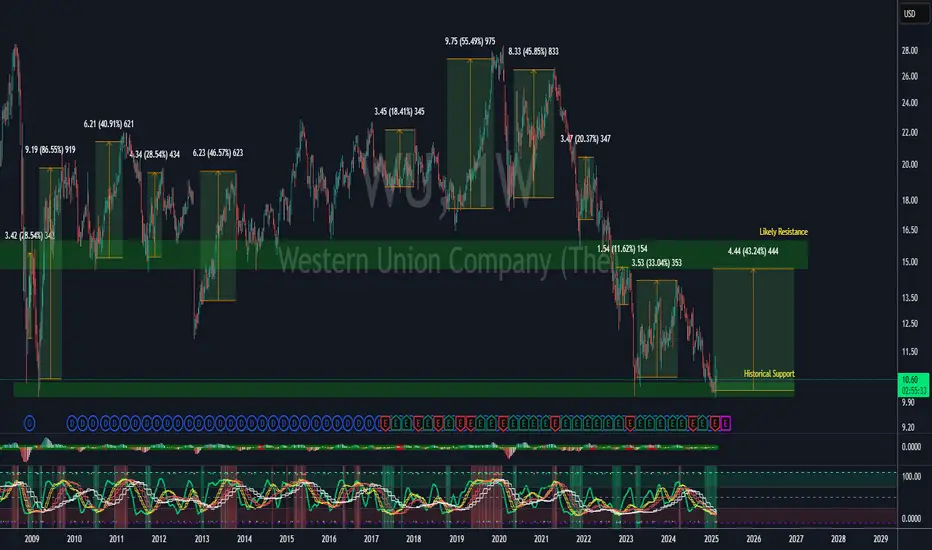
Wave Master

OVERBOUGHT
When all waves have all migrated to the overbought area, this is a high probability area to go short or take profit off the table.
OVERSOLD
When all waves have migrated to the oversold area, typically this indicates a high probability place to take a long position or purchase some equity.
VISUAL AIDS
Several visual aids have been included in this indicator to assist you, as a trader, to help you easily see what is going on.
- Upper/Lower Dots - Green/Yellow/Red dots indicate a cross has occurred. Each color corresponding with the wave in the indicator
- Color Coded Background - Red indicates green/yellow wave have gone into overbought territory and green background indicates green/yellow wave have gone into oversold territory. White slices in the background indicate the green has crossed (while in overbought/oversold)
- 12h/daily candle confirmation - When the 12hr (crypto) or daily (stocks) have crossed, a bright green or bright red candle will appear in the chart to help you indicate a potential for a change in trend
**FOUR TRADING MODES**
Scalp - Must use on 1 minute timeframe - This mode is designed to be used for quick positions that typically last 5-20 minutes.
Day - Used for day trading and needs to be used on 15 minute timeframes - This mode is designed to be used for positions that last anywhere from 30 minute to 4 hours.
Swing - Default Mode - Must be used on 1 hour timeframe - This is the mode that was previously the only mode for the wave master indicator and is the default mode in this update - These trades typically last 1-4 days
Swing-htf - Must be used on 4 hour timeframe - Trades taken using this mode require a lot of patience and/or set and forget mentality and should expect to last several days to several weeks.
Note: Guru mode is still in development and is in an experimental mode currently.
Supported timeframes currently include: 1, 3, 5, 10, 15, 30, 45, 60, 120, 180, 240, 1D
The modes that previously existed such as scalp, day, swing and swing-htf have been removed as the chart automatically adjusts when moving to those timeframes.
Note: Manual override is currently unused and will be included in a later release.
Modes have been brought back due to popular demand with two new modes added: dynamic (default) and override.
- Dynamic Mode will continue to dynamically update the wave timeframes used as you change the timeframe of your chart
- Override Mode will allow you to specify the wave timeframes you want to use in the event you use nonstandard timeframes
A Detail mode has also been introduced. This will allow you to reduce clutter and only show the fast wave of the green/yellow/red waves. This will hide the slow wave, but you will still be able to utilize the circle helpers at the top and bottom of the indicator to visually identify wave crosses.
Unrelated to what users visually see, code has been cleaned up and optimized to run slightly quicker.
The update included in this is not functionally different from before. Due to customer requests, I have added the ability to adjust the overbought and oversold thresholds.
Script sob convite
Somente usuários aprovados pelo autor podem acessar este script. Você precisará solicitar e obter permissão para usá-lo. Normalmente, essa permissão é concedida após o pagamento. Para obter mais detalhes, siga as instruções do autor abaixo ou entre em contato diretamente com bitdoctor.
A TradingView NÃO recomenda pagar ou usar um script, a menos que você confie totalmente em seu autor e entenda como ele funciona. Você também pode encontrar alternativas gratuitas e de código aberto em nossos scripts da comunidade.
Instruções do autor
Access our private indicators and join our Premium Room: bitdoctor.org
Beware of scams - I'll never DM you asking for funds.
Aviso legal
Script sob convite
Somente usuários aprovados pelo autor podem acessar este script. Você precisará solicitar e obter permissão para usá-lo. Normalmente, essa permissão é concedida após o pagamento. Para obter mais detalhes, siga as instruções do autor abaixo ou entre em contato diretamente com bitdoctor.
A TradingView NÃO recomenda pagar ou usar um script, a menos que você confie totalmente em seu autor e entenda como ele funciona. Você também pode encontrar alternativas gratuitas e de código aberto em nossos scripts da comunidade.
Instruções do autor
Access our private indicators and join our Premium Room: bitdoctor.org
Beware of scams - I'll never DM you asking for funds.