PROTECTED SOURCE SCRIPT
OGT Bollinger Bands Trend Indicator
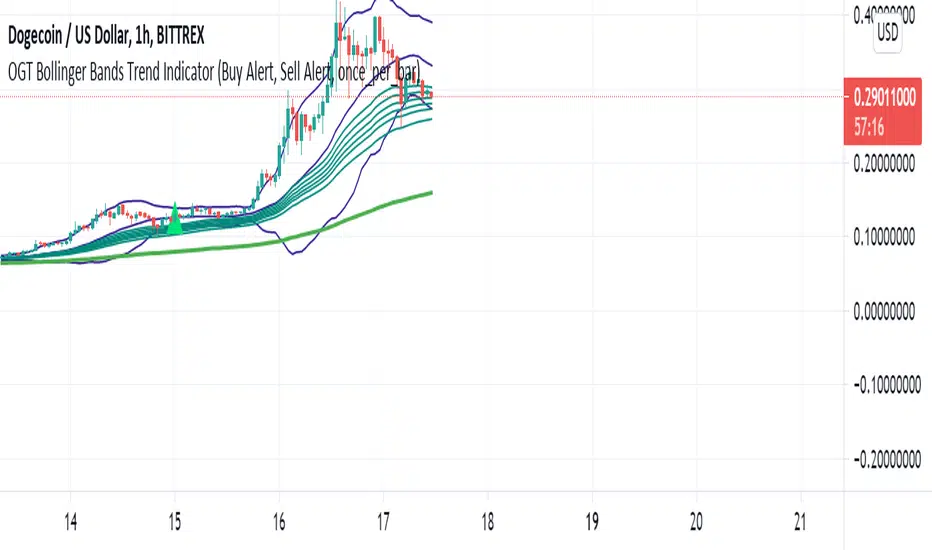
What Is The OGT Bollinger Bands Trend Indicator?
This indicator is a pullback trend trading indicator which uses the following indicators:
- 200 EMA - Long Term Trend Direction
- 30, 35, 40, 45, 50, 60 EMAs - Shorter Term Trend Direction
- Bollinger Bands - Pullback / Entry Signal
How Are Signals Generated?
Buy
- Price above the 200 EMA
- Price touches lower BB with shorter term EMAs all aligned (not crossed)
- Indicator waits for price to close above midpoint BB with shorter term EMAs all still aligned (not crossed)
Sell
- Price below the 200 EMA
- Price touches upper BB with shorter term EMAs all aligned (not crossed)
- Indicator waits for price to close above midpoint BB with shorter term EMAs all still aligned (not crossed)
Alerts function built in, input settings customisable to show/not show indicators and change colours.
Script protegido
Esse script é publicada como código fechado. No entanto, você pode gerenciar suas escolhas de bate-papo. Por favor, abra suas Configurações do perfil
Aviso legal
As informações e publicações não se destinam a ser, e não constituem, conselhos ou recomendações financeiras, de investimento, comerciais ou de outro tipo fornecidos ou endossados pela TradingView. Leia mais nos Termos de Uso.