OPEN-SOURCE SCRIPT
Elliptic Curve SAR
Overview
The Elliptic Curve SAR indicator is an innovative twist on the traditional Parabolic SAR. Instead of relying solely on a fixed parabolic acceleration, this indicator incorporates elements from elliptic curve mathematics. It uses an elliptic curve defined by the equation y² = x³ + ax + b* along with a configurable base point, dynamically adjusting its acceleration factor to potentially offer different smoothing and timing in trend detection.
How It Works
Elliptic Curve Parameters:
The indicator accepts curve parameters a and b that define the elliptic curve.
A base point (x_p, y_p) on the curve is used as a starting condition.
Dynamic Acceleration:
Instead of a fixed acceleration step, the script computes a dynamic acceleration based on the current value of an intermediate variable (derived via the elliptic curve's properties).
An arctan function is used to non-linearly adjust the acceleration between a defined initial and maximum bound.
Trend & Reversal Detection:
The indicator tracks the current trend (up or down) using the computed SAR value.
It identifies trend reversals by comparing the current price with the SAR, and when a reversal is detected, it resets key parameters such as the Extreme Point (EP).
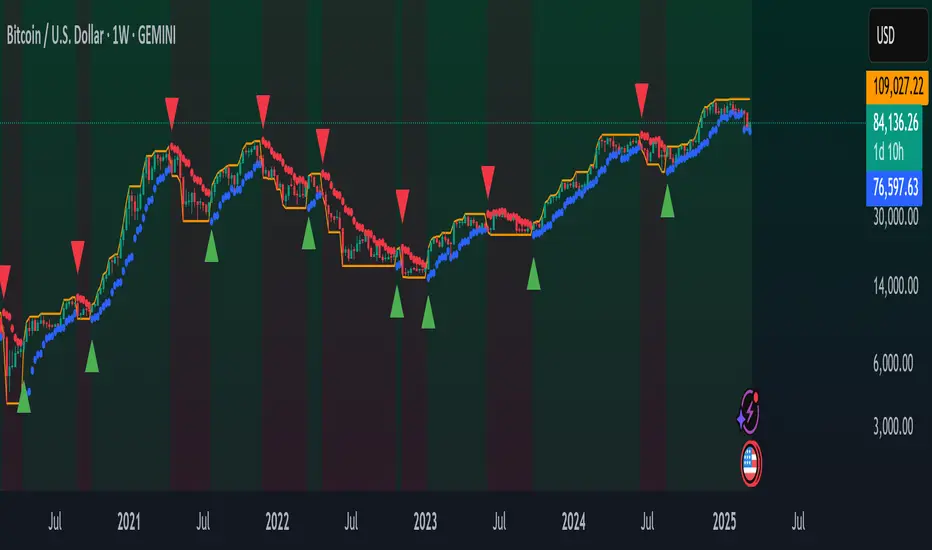
Visual Enhancements:
SAR Plot: Plotted as circles that change color based on trend direction (blue for uptrends, red for downtrends).
Extreme Point (EP): An orange line is drawn to show the highest high in an uptrend or the lowest low in a downtrend.
Reversal Markers: Green triangles for upward reversals and red triangles for downward reversals are displayed.
Background Color: A subtle background tint (light green or light red) reflects the prevailing trend.
How to Use the Indicator
Input Configuration:
Curve Parameters:
Adjust a and b to define the specific elliptic curve you wish to apply.
Base Point Settings:
Configure the base point (x_p, y_p) to set the starting conditions for the elliptic curve calculations.
Acceleration Settings:
Set the Initial Acceleration and Max Acceleration to tune the sensitivity of the indicator.
Chart Application:
Overlay the indicator on your price chart. The SAR values, Extreme Points, and reversal markers will be plotted directly on the price data.
Use the dynamic background color to quickly assess the current trend.
Customization:
You can further adjust colors, line widths, and shape sizes in the code to better suit your visual preferences.
Differences from the Traditional SAR
Calculation Methodology:
Traditional SAR relies on a parabolic curve with a fixed acceleration factor, which increases linearly as the trend continues.
Elliptic Curve SAR uses a mathematically-derived approach from elliptic curve theory, which dynamically adjusts the acceleration factor based on the curve’s properties.
Sensitivity and Signal Timing:
The use of the arctan function and elliptic curve addition provides a non-linear response to price movements. This may result in a different sensitivity to market conditions and potentially smoother or more adaptive signal generation.
Visual Enhancements:
The enhanced version includes trend-dependent colors, explicit reversal markers, and an Extreme Point plot that are not present in the traditional version.
The background color change further aids in visual trend recognition.
Conclusion
The Elliptic Curve SAR indicator offers an alternative approach to trend detection by integrating elliptic curve mathematics into its calculation. This results in a dynamic acceleration factor and enriched visual cues, providing traders with an innovative tool for market analysis. By fine-tuning the input parameters, users can adapt the indicator to better fit their specific trading style and market conditions.
The Elliptic Curve SAR indicator is an innovative twist on the traditional Parabolic SAR. Instead of relying solely on a fixed parabolic acceleration, this indicator incorporates elements from elliptic curve mathematics. It uses an elliptic curve defined by the equation y² = x³ + ax + b* along with a configurable base point, dynamically adjusting its acceleration factor to potentially offer different smoothing and timing in trend detection.
How It Works
Elliptic Curve Parameters:
The indicator accepts curve parameters a and b that define the elliptic curve.
A base point (x_p, y_p) on the curve is used as a starting condition.
Dynamic Acceleration:
Instead of a fixed acceleration step, the script computes a dynamic acceleration based on the current value of an intermediate variable (derived via the elliptic curve's properties).
An arctan function is used to non-linearly adjust the acceleration between a defined initial and maximum bound.
Trend & Reversal Detection:
The indicator tracks the current trend (up or down) using the computed SAR value.
It identifies trend reversals by comparing the current price with the SAR, and when a reversal is detected, it resets key parameters such as the Extreme Point (EP).
Visual Enhancements:
SAR Plot: Plotted as circles that change color based on trend direction (blue for uptrends, red for downtrends).
Extreme Point (EP): An orange line is drawn to show the highest high in an uptrend or the lowest low in a downtrend.
Reversal Markers: Green triangles for upward reversals and red triangles for downward reversals are displayed.
Background Color: A subtle background tint (light green or light red) reflects the prevailing trend.
How to Use the Indicator
Input Configuration:
Curve Parameters:
Adjust a and b to define the specific elliptic curve you wish to apply.
Base Point Settings:
Configure the base point (x_p, y_p) to set the starting conditions for the elliptic curve calculations.
Acceleration Settings:
Set the Initial Acceleration and Max Acceleration to tune the sensitivity of the indicator.
Chart Application:
Overlay the indicator on your price chart. The SAR values, Extreme Points, and reversal markers will be plotted directly on the price data.
Use the dynamic background color to quickly assess the current trend.
Customization:
You can further adjust colors, line widths, and shape sizes in the code to better suit your visual preferences.
Differences from the Traditional SAR
Calculation Methodology:
Traditional SAR relies on a parabolic curve with a fixed acceleration factor, which increases linearly as the trend continues.
Elliptic Curve SAR uses a mathematically-derived approach from elliptic curve theory, which dynamically adjusts the acceleration factor based on the curve’s properties.
Sensitivity and Signal Timing:
The use of the arctan function and elliptic curve addition provides a non-linear response to price movements. This may result in a different sensitivity to market conditions and potentially smoother or more adaptive signal generation.
Visual Enhancements:
The enhanced version includes trend-dependent colors, explicit reversal markers, and an Extreme Point plot that are not present in the traditional version.
The background color change further aids in visual trend recognition.
Conclusion
The Elliptic Curve SAR indicator offers an alternative approach to trend detection by integrating elliptic curve mathematics into its calculation. This results in a dynamic acceleration factor and enriched visual cues, providing traders with an innovative tool for market analysis. By fine-tuning the input parameters, users can adapt the indicator to better fit their specific trading style and market conditions.
Script de código aberto
Em verdadeiro espírito do TradingView, o criador deste script o tornou de código aberto, para que os traders possam revisar e verificar sua funcionalidade. Parabéns ao autor! Embora você possa usá-lo gratuitamente, lembre-se de que a republicação do código está sujeita às nossas Regras da Casa.
Aviso legal
As informações e publicações não se destinam a ser, e não constituem, conselhos ou recomendações financeiras, de investimento, comerciais ou de outro tipo fornecidos ou endossados pela TradingView. Leia mais nos Termos de Uso.