OPEN-SOURCE SCRIPT
Sector Analysis [SS]
Introducing the most powerful sector analysis tool/indicator available, to date, in Pine!
This is a whopper indicator, so be sure to read carefully to ensure you understand its applications and uses!
First of all, because this is a whopper, let's go over the key functional points of the indicator.
The indicator compares the 11 main sector ETFs against whichever ticker you are looking at.
The functions include the following:
These are the highlight functions. Below, I will go more into them, what they mean and how to use them.
Pulling Technicals
This is pretty straight forward. You can pull technicals, such as RSI, Stochastic and Z-Score from all the sector ETFs and view them in a table.
See below for the example:

Pulling Correlation
In order to see which sector your ticker of interest follows more closely, we need to look first at correlation and then at R2.
The correlation will look at the immediate relationship over a specified time. A highly positive value, indicates a strong, symbiotic relationship, which the sector and the ticker follow each other. This would be represented by a correlation of 0.8 or higher.
A strong negative correlation, such as -0.8 or lower, indicates that the sector and the ticker are completely opposite. When one goes up, the other goes down and vice versa.
You can adjust your correlation assessment length directly in the settings menu:

If you want to use a sector ETF to find the expected range for a ticker of interest, it is important to locate the highest, POSITIVE, correlation value. Here are the results for MSFT at a correlation lookback of 200:

In this example, we can see the best relationship is with the ETF XLK.
Analysis of R2
R2 is an important metric. It essentially measures how much of the variance between 2 tickers are explained by a simple, linear relationship.
A high R2 means that a huge degree of variance can be explained between the 2 tickers. A low R2 means that it cannot and that the 2 tickers are likely not integrated or closely related.
In general, if you want to use the sector ETF to find the mean and trading range and identify over-valuation/over-extension and under-extension statistically, you need to see both a high correlation and a high R-Squared. These 2 metrics should be analyzed together.
Let's take a look at MSFT:

Here, despite the correlation implying that XLK was the ticker we should use to analyze, when we look at the R Squared, we see actually, we should be using XLI.
XLI has a strong positive relationship with MSFT, albeit a bit less than XLK, but the R2 is solid, > 0.9, indicating the XLI explains much of MSFT's variance.
Two Tailed T-Test
A two tailed T-test analyzes whether there is a statistically significant difference between 2 different groups, or in our case, tickers.
The T-Test is conducted on the log returns of the ticker of interest and the sector. You then can see the P value results, whether it is significant or not. Let's look at MSFT again:

Looking at this, we can see there is no statistically significant difference in returns between MSFT and any of the sectors.
We can also see the SMA of the log returns for more detailed comparison.
If we were to observe a significant finding on the T-Test metrics, this would indicate that one sector either outperforms or underperforms your ticker to a statistically significant degree! If you stumble upon this, you would check the average log returns to compare against the average returns of your ticker of interest, to see whether there is better performance or worse performance from the sector ETF vs. your ticker of interest.
Analyzing the Distribution
The indicator will also analyze the distribution of returns.
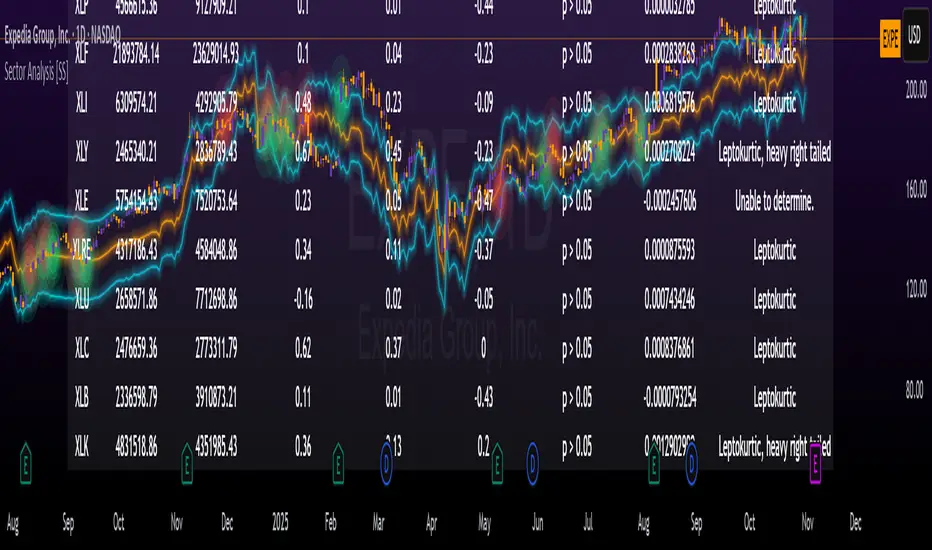
This is an interesting option as it can help you ascertain risk. Normally distributed returns imply mean reverting behavviour. Deviations from that imply trending behaviour with higher risk expectancy. If we look at the distribution statistics currently over the last 200 trading days, here are the results:

Here, we can see all show signs of trending, as none of the returns are normally distributed. The highest risk sectors are XLK and XLY.
Why are they the highest risk?
Because the indicator has found a heavy right tailed distribution, indicated sudden and erratic mean reversion/losses are possible.
Creating an MA
Now for the big bonus of the indicator!
The indicator can actually create a regression based range from closely correlated sectors, so you can see, in sectors that are strongly correlated to your ticker, whether your ticker is over-bought, oversold or has mean reverted.
Let's look at MSFT using XLI, our previously identified sector with a high correlation and high R2 value:

The results are pretty impressive.
You can see that MSFT has rode the mean of the sector on the daily timeframe for quite some time. Each time it over extended itself above the sector implied range, it mean reverted.
Currently, if you were to trade based on Pairs or statistics, MSFT is no trade as it is currently trading at its sector mean.
If you are a visual person, you can have the indicator plot the mean reversion points directly:

Green represents a bullish mean reversion and red a bearish mean reversion.
Concluding Remarks
If you like pair trading, following the link between sectors and tickers or want a more objective way to determine whether a ticker is over-bought or oversold, this indicator can help you.
In addition to doing this, the indicator can provide risk insights into different sectors by looking at the distribution, as well as identify under-performing sectors or tickers.
It can also shed light on sectors that may be technically over-bought or oversold by looking at Z-Score, stochastics and RSI.
Its a whopper and I really hope you find it helpful and useful!
Thanks everyone for reading and checking this out!
Safe trades!
This is a whopper indicator, so be sure to read carefully to ensure you understand its applications and uses!
First of all, because this is a whopper, let's go over the key functional points of the indicator.
The indicator compares the 11 main sector ETFs against whichever ticker you are looking at.
The functions include the following:
- Ability to pull technicals from the sectors, such as RSI, Stochastic and Z-Score;
- Ability to look at the correlation of the sector ETF to the current ticker you are looking at.
- Ability to calculate the R2 value between the ticker you are looking at and each sector.
- The ability to run a Two Tailed T-Test against the log returns of the Ticker of interest and the Sector (to analyze statistically significant returns between sectors/tickers).
- The ability to analyze the distribution of returns across all sector ETFs.
- The ability to pull buying and selling volume across all sector ETFs.
- The ability to create an integrated moving average using a sector ETF to predict the expected close range of a ticker of interest.
These are the highlight functions. Below, I will go more into them, what they mean and how to use them.
Pulling Technicals
This is pretty straight forward. You can pull technicals, such as RSI, Stochastic and Z-Score from all the sector ETFs and view them in a table.
See below for the example:
Pulling Correlation
In order to see which sector your ticker of interest follows more closely, we need to look first at correlation and then at R2.
The correlation will look at the immediate relationship over a specified time. A highly positive value, indicates a strong, symbiotic relationship, which the sector and the ticker follow each other. This would be represented by a correlation of 0.8 or higher.
A strong negative correlation, such as -0.8 or lower, indicates that the sector and the ticker are completely opposite. When one goes up, the other goes down and vice versa.
You can adjust your correlation assessment length directly in the settings menu:
If you want to use a sector ETF to find the expected range for a ticker of interest, it is important to locate the highest, POSITIVE, correlation value. Here are the results for MSFT at a correlation lookback of 200:
In this example, we can see the best relationship is with the ETF XLK.
Analysis of R2
R2 is an important metric. It essentially measures how much of the variance between 2 tickers are explained by a simple, linear relationship.
A high R2 means that a huge degree of variance can be explained between the 2 tickers. A low R2 means that it cannot and that the 2 tickers are likely not integrated or closely related.
In general, if you want to use the sector ETF to find the mean and trading range and identify over-valuation/over-extension and under-extension statistically, you need to see both a high correlation and a high R-Squared. These 2 metrics should be analyzed together.
Let's take a look at MSFT:
Here, despite the correlation implying that XLK was the ticker we should use to analyze, when we look at the R Squared, we see actually, we should be using XLI.
XLI has a strong positive relationship with MSFT, albeit a bit less than XLK, but the R2 is solid, > 0.9, indicating the XLI explains much of MSFT's variance.
Two Tailed T-Test
A two tailed T-test analyzes whether there is a statistically significant difference between 2 different groups, or in our case, tickers.
The T-Test is conducted on the log returns of the ticker of interest and the sector. You then can see the P value results, whether it is significant or not. Let's look at MSFT again:
Looking at this, we can see there is no statistically significant difference in returns between MSFT and any of the sectors.
We can also see the SMA of the log returns for more detailed comparison.
If we were to observe a significant finding on the T-Test metrics, this would indicate that one sector either outperforms or underperforms your ticker to a statistically significant degree! If you stumble upon this, you would check the average log returns to compare against the average returns of your ticker of interest, to see whether there is better performance or worse performance from the sector ETF vs. your ticker of interest.
Analyzing the Distribution
The indicator will also analyze the distribution of returns.
This is an interesting option as it can help you ascertain risk. Normally distributed returns imply mean reverting behavviour. Deviations from that imply trending behaviour with higher risk expectancy. If we look at the distribution statistics currently over the last 200 trading days, here are the results:
Here, we can see all show signs of trending, as none of the returns are normally distributed. The highest risk sectors are XLK and XLY.
Why are they the highest risk?
Because the indicator has found a heavy right tailed distribution, indicated sudden and erratic mean reversion/losses are possible.
Creating an MA
Now for the big bonus of the indicator!
The indicator can actually create a regression based range from closely correlated sectors, so you can see, in sectors that are strongly correlated to your ticker, whether your ticker is over-bought, oversold or has mean reverted.
Let's look at MSFT using XLI, our previously identified sector with a high correlation and high R2 value:
The results are pretty impressive.
You can see that MSFT has rode the mean of the sector on the daily timeframe for quite some time. Each time it over extended itself above the sector implied range, it mean reverted.
Currently, if you were to trade based on Pairs or statistics, MSFT is no trade as it is currently trading at its sector mean.
If you are a visual person, you can have the indicator plot the mean reversion points directly:
Green represents a bullish mean reversion and red a bearish mean reversion.
Concluding Remarks
If you like pair trading, following the link between sectors and tickers or want a more objective way to determine whether a ticker is over-bought or oversold, this indicator can help you.
In addition to doing this, the indicator can provide risk insights into different sectors by looking at the distribution, as well as identify under-performing sectors or tickers.
It can also shed light on sectors that may be technically over-bought or oversold by looking at Z-Score, stochastics and RSI.
Its a whopper and I really hope you find it helpful and useful!
Thanks everyone for reading and checking this out!
Safe trades!
Script de código aberto
Em verdadeiro espírito do TradingView, o criador deste script o tornou de código aberto, para que os traders possam revisar e verificar sua funcionalidade. Parabéns ao autor! Embora você possa usá-lo gratuitamente, lembre-se de que a republicação do código está sujeita às nossas Regras da Casa.
Get:
- Live Updates,
- Discord access,
- Access to my Proprietary Merlin Software,
- Access to premium indicators,
patreon.com/steversteves
Now on X!
- Live Updates,
- Discord access,
- Access to my Proprietary Merlin Software,
- Access to premium indicators,
patreon.com/steversteves
Now on X!
Aviso legal
As informações e publicações não se destinam a ser, e não constituem, conselhos ou recomendações financeiras, de investimento, comerciais ou de outro tipo fornecidos ou endossados pela TradingView. Leia mais nos Termos de Uso.