PROTECTED SOURCE SCRIPT
Atualizado ICT SM Trades (liquidity find & grab, MSS, FVG, killzones)
Indicator looks for ICT & Smart Money trades on any timeframe. These types of trades reveal how the big institutions, banks and hedge funds trade with big money. If they want their very big positions to be filled they need to find areas in chart where the majority of the money is sitting. Where is it? Where is the majority of orders placed? Right below supports or right above resistance, these orders are stoplosses or stop orders. So they need to push the price to these areas, take all the available stoplosses and trigger all the available stop orders in order to fill their positions and then push the price to the opposite side to make profit (and retail to lose).
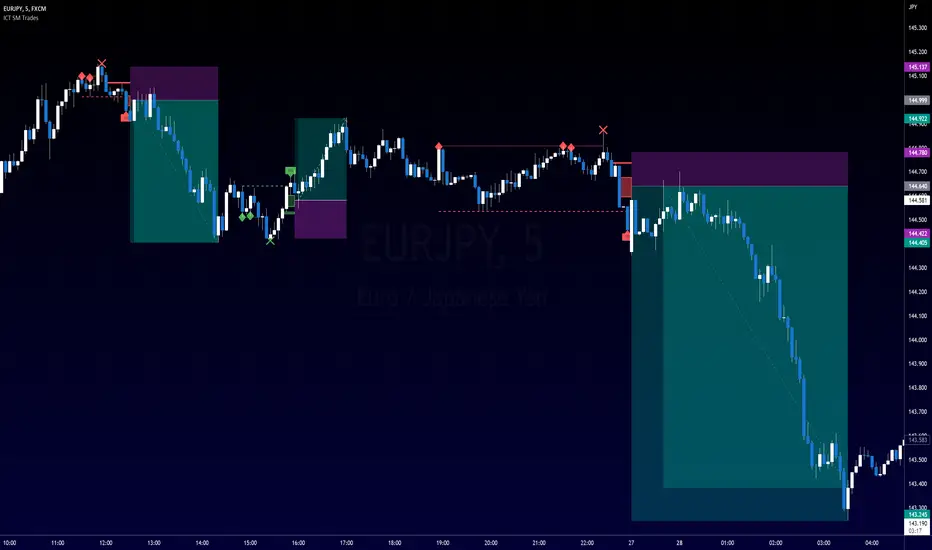
Indicator looks for support or resistance (S/R) areas which are represented by dotted lines. This S/R areas are created by minimum of 2 pivot high/low (H/L). Every pivot H/L that creates the S/R area is marked with diamond label. This S/R area is called liquidity. After liquidity is created, indicator looks for liquidity grab (mostly represented by fast spike to this area - it is labeled with x-cross) and then price should go fast to the opposite side of the created structure. Indicator considers as a created structure everything that was created on the other side of the candles from the oldest pivot H/L which creates particular liquidity. For example, if liquidity is created with 3 pivot highs, indicator looks at the oldest pivot high and from there it is looking for the lowest low. Under this lowest low is dashed line which means that this level should be broken with closed candle. This action is called market structure shift (MSS), when the price shifted very fast from highs to lows. After MSS, when the price went fast to one direction, there were some imbalances in prices, in our example selling pressure was a lot bigger than buying pressure and there were created some long untested bearish candles. This untested areas in candles are called imbalances or gaps of fair value gaps (FVG). These are labeled with rectangles. It is expected that these gaps will be tested in near future to "balance the market".
We can put limit orders into these gaps and await some retracement after MSS to open our positions and after the positions are opened we can expect trend continuation in the direction where market structure shift was made (away from liquidity grab). So stoplosses can be placed above/below liquidity grab candle (marked with x-cross).
In settings of the indicator you can set whether only long or only short trades will be shown. Long trades are green and short trades are red. You can set if fair value gaps will be shown as well. The last thing in settings is session. You can set custom session which will be shown as background color on your chart.
Notas de Lançamento
Customizable long & short trades colors in indicator settings.Notas de Lançamento
Middle lines in fair value gaps can be shown in indicator settings, session color can be customized in indicator settings.Notas de Lançamento
Indicator updates:- renders live trades,
- renders more trades than before,
- is faster.
Notas de Lançamento
Customizable MSS by close or H/L in indicator settings.Notas de Lançamento
Fix for customizable MSS by H/L (more trades showed up than allowed)Notas de Lançamento
Script loading time has been reduced tremendously.Notas de Lançamento
Timezone for session has been added and indicator settings have been reorganized into groups.Notas de Lançamento
Customizable ATR Length has been added into indicator core settings.Notas de Lançamento
Calculation speed optimalization has been implemented.Notas de Lançamento
Calculation bug has been fixed.Notas de Lançamento
New liquidity types have been added:- Pivot Liquidity Grab + MSS,
- Daily H/L Liquidity Grab + MSS (historical only),
- Weekly H/L Liquidity Grab + MSS,
- Session H/L Liquidity Grab + MSS (historical only).
Notas de Lançamento
Bug with max_bars_back error has been fixed.Notas de Lançamento
Loading speed has been improved.Script protegido
Esse script é publicada como código fechado. No entanto, você pode gerenciar suas escolhas de bate-papo. Por favor, abra suas Configurações do perfil
Aviso legal
As informações e publicações não se destinam a ser, e não constituem, conselhos ou recomendações financeiras, de investimento, comerciais ou de outro tipo fornecidos ou endossados pela TradingView. Leia mais nos Termos de Uso.
Script protegido
Esse script é publicada como código fechado. No entanto, você pode gerenciar suas escolhas de bate-papo. Por favor, abra suas Configurações do perfil
Aviso legal
As informações e publicações não se destinam a ser, e não constituem, conselhos ou recomendações financeiras, de investimento, comerciais ou de outro tipo fornecidos ou endossados pela TradingView. Leia mais nos Termos de Uso.