OPEN-SOURCE SCRIPT
Atualizado Pivot Support and Resistance Finder [JV] V1
Hi Traders.
This is my first attempt of writing an indicator.
Let me start by saying I could never have done this without lmatl and WMX_Q_System_Trading who were and are an incredible source of inspiration.
This indicator shows horizontal Pivot Support and Resistance . It draws up to 4 horizontal lines extending to the right from and adds labels to High and Low Pivot Candles . It also draws the Support / Resistance that is currently forming.
You can select the number of lines on the current timeframe.
There are some options in Settings:
Any suggestions are more than welcome!
I also welcome donations, no matter how small ;-)
This is my first attempt of writing an indicator.
Let me start by saying I could never have done this without lmatl and WMX_Q_System_Trading who were and are an incredible source of inspiration.
This indicator shows horizontal Pivot Support and Resistance . It draws up to 4 horizontal lines extending to the right from and adds labels to High and Low Pivot Candles . It also draws the Support / Resistance that is currently forming.
You can select the number of lines on the current timeframe.
There are some options in Settings:
- Current timeframe pivot settings
- Show and hide levels of the current timeframe
- Change colors
- Extend Lines
Any suggestions are more than welcome!
I also welcome donations, no matter how small ;-)
Notas de Lançamento
Fixed two typo's.- Fourt -> Fourth
- in showFourthPivot I had two different occurrences. Fixed that to keep consistancy.
Notas de Lançamento
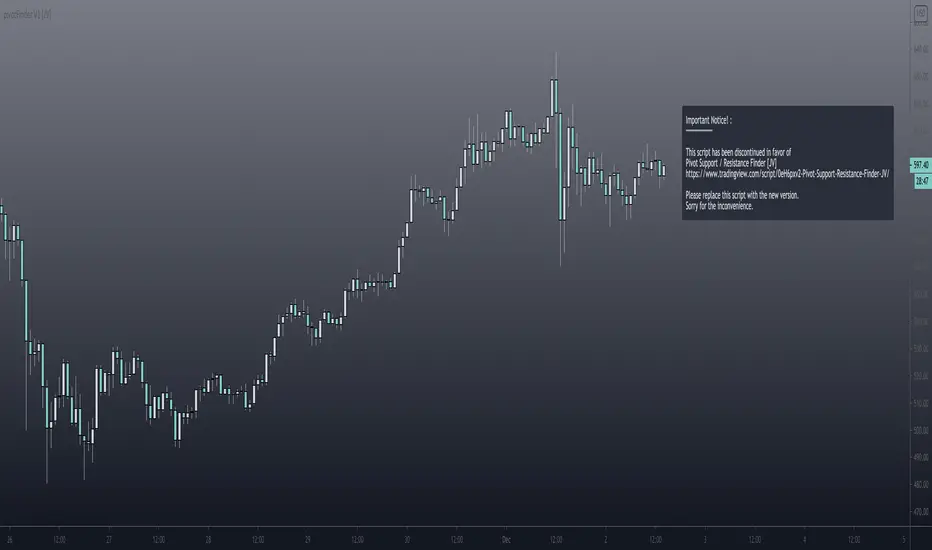
Just an update to inform user of the discontinuation of this script in favor of V2.Notas de Lançamento
Changed Info Label to notify user of upcoming improvements.Notas de Lançamento
Changed Info Label colors and added correct screenshotNotas de Lançamento
Hi Traders,this is the result of the many feedback messages I received about this first draft of this script. It has significant updates:
- The use of Arrays.
- Using PineCoders Coding Conventions for Pine: pinecoders.com/coding_conventions/.
- Display up to 6 Support / Resistance levels.
- Line colors and Labels change according to their status (Support or Resistance).
- Moved Labels to the future for better overview of the Prices / Levels.
There are many configurable options. Feel free to explore them all.
If you should notice a bug or something of a kind, feel free to contact me.
All feedback is very welcome as well.
Request might be considered but don't take them for granted please.
Pivot Points
Pivot Points are considered to be levels which may become significant levels (Support / Resistance) in the future. They can be interpreted in various ways, but fact is that price, when it comes close to a previous Pivot Point, can mess with your head. Prices often returns to previous Pivot Points, more than once even a few times, as shown below.
I hope you find this useful.
Happy trading!
Notas de Lançamento
Notice of discontinuation of this script.Script de código aberto
Em verdadeiro espírito do TradingView, o criador deste script o tornou de código aberto, para que os traders possam revisar e verificar sua funcionalidade. Parabéns ao autor! Embora você possa usá-lo gratuitamente, lembre-se de que a republicação do código está sujeita às nossas Regras da Casa.
Aviso legal
As informações e publicações não se destinam a ser, e não constituem, conselhos ou recomendações financeiras, de investimento, comerciais ou de outro tipo fornecidos ou endossados pela TradingView. Leia mais nos Termos de Uso.
Script de código aberto
Em verdadeiro espírito do TradingView, o criador deste script o tornou de código aberto, para que os traders possam revisar e verificar sua funcionalidade. Parabéns ao autor! Embora você possa usá-lo gratuitamente, lembre-se de que a republicação do código está sujeita às nossas Regras da Casa.
Aviso legal
As informações e publicações não se destinam a ser, e não constituem, conselhos ou recomendações financeiras, de investimento, comerciais ou de outro tipo fornecidos ou endossados pela TradingView. Leia mais nos Termos de Uso.