PROTECTED SOURCE SCRIPT
VIX (StevenCharts)
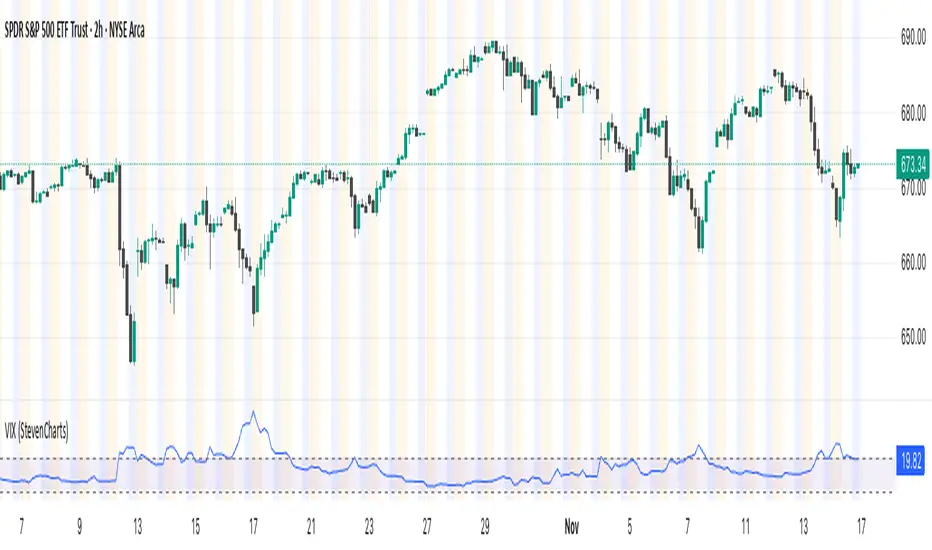
This indicator plots the VIX (CBOE Volatility Index) in a separate pane to help you quickly gauge market sentiment and volatility.
It highlights the key zone between 15 and 20, which often acts as a transition area between low and high-volatility regimes.
Features:
Plots the VIX line.
Allows you to change the color of the VIX line.
It highlights the key zone between 15 and 20, which often acts as a transition area between low and high-volatility regimes.
Features:
Plots the VIX line.
Allows you to change the color of the VIX line.
Script protegido
Esse script é publicada como código fechado. No entanto, você pode gerenciar suas escolhas de bate-papo. Por favor, abra suas Configurações do perfil
Aviso legal
As informações e publicações não se destinam a ser, e não constituem, conselhos ou recomendações financeiras, de investimento, comerciais ou de outro tipo fornecidos ou endossados pela TradingView. Leia mais nos Termos de Uso.