PROTECTED SOURCE SCRIPT
OB EMA Fibo Tunnel
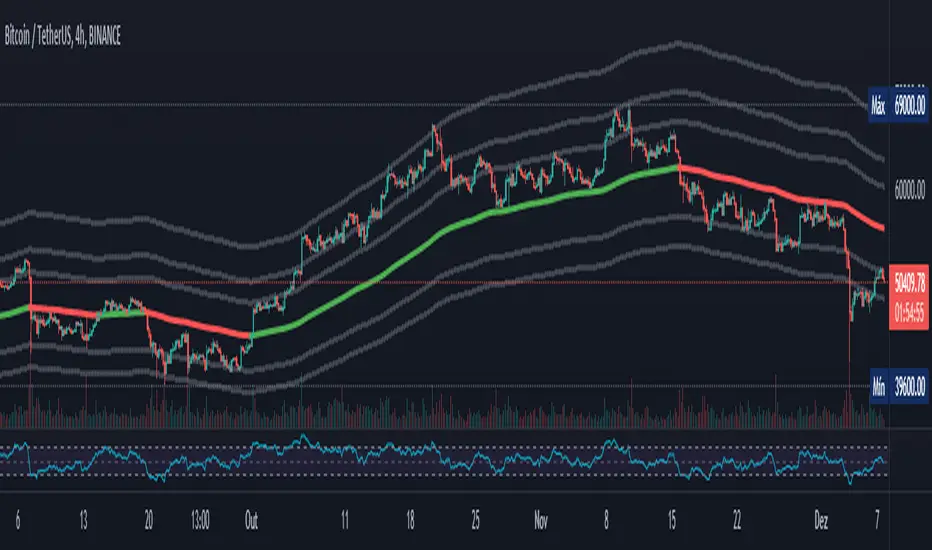
This indicator plots a base EMA and then plot many lines above and below according to the Fibonacci levels, creating a tunnel where it is possible to see the price respecting some levels.
It is similar the concept of Vegas Tunnel, but with my numbers.
The Base EMA is 26 for daily charts and 8 for Weekly charts. The smaller timeframes use a variation of 26, like 26*4 for 4h charts.
It is also possible to choose if you want to color candle bars and what levels of Fibo lines you want to see. I created that to have a clean chart.
*** To enable the colored candles, you should choose the visual order and move to top!
Please leave a comment if you liked and if you have any suggestion.
Script protegido
Esse script é publicada como código fechado. No entanto, você pode gerenciar suas escolhas de bate-papo. Por favor, abra suas Configurações do perfil
Aviso legal
As informações e publicações não se destinam a ser, e não constituem, conselhos ou recomendações financeiras, de investimento, comerciais ou de outro tipo fornecidos ou endossados pela TradingView. Leia mais nos Termos de Uso.