PROTECTED SOURCE SCRIPT
Atualizado FUSIONGAPS V4 {50/15-Series}
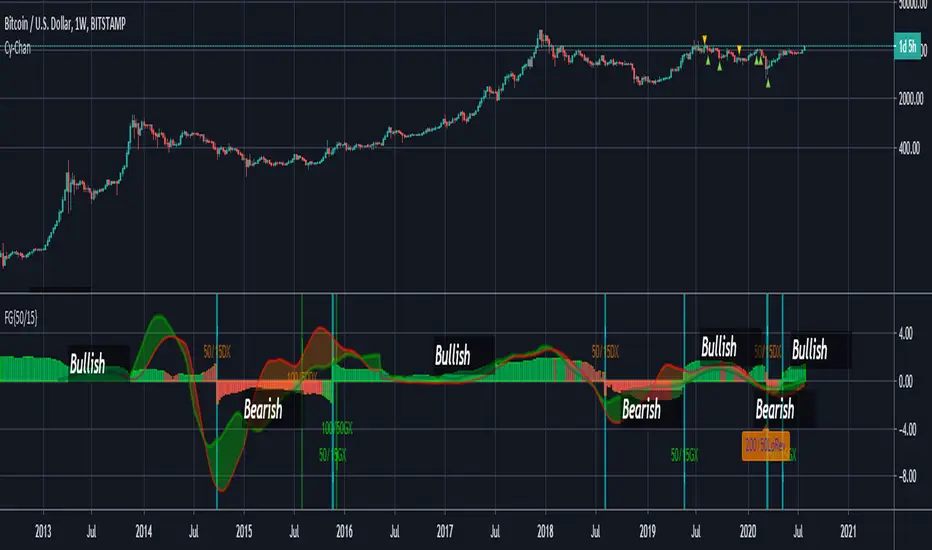
Base on the FUSIONGAPS oscillator series, but Only the 50/15 oscillator is plotted, and with Momentum and Acceleration oscillators added.
Indicators:
DeathCrosses ( DX ) and GoldenCrosses ( GX )
Momentum Reversal indicators (D2FG based filter applied to reduce false-positives, but can be manually disabled.)
~ * ~ * ~ * ~ * ~ * ~ * ~ * ~ * ~ * ~ * ~ * ~ * ~ * ~ * ~ * ~ * ~ * ~ * ~ * ~ * ~
Note:
In no way is this intended as a financial/investment/trading advice. You are responsible for your own investment decisions and trades.
Please exercise your own judgement for your own trades base on your own risk-aversion level and goals as an investor or a trader. The use of OTHER indicators and analysis in conjunction (tailored to your own style of investing/trading) will help improve confidence of your analysis, for you to determine your own trade decisions.
~ * ~ * ~ * ~ * ~ * ~ * ~ * ~ * ~ * ~ * ~ * ~ * ~ * ~ * ~ * ~ * ~ * ~ * ~ * ~ * ~
Please check out my other indicators sets and series, e.g.
Constructive feedback and suggestions are welcome.
~JuniAiko
(=^~^=)v~
- The thickest line is the FG oscillator: Red/Green coloring indicates if the market is in a Bearish/Bullish period.
- The green colored line is the DFG oscillator (DIFFERENTIAL FUSIONGAPS: Price Momentum)
- The red colored line is the D2FG oscillator (DOUBLE-DIFFERENTIAL FUSIONGAPS: Price Acceleration)
Indicators:
DeathCrosses ( DX ) and GoldenCrosses ( GX )
Momentum Reversal indicators (D2FG based filter applied to reduce false-positives, but can be manually disabled.)
~ * ~ * ~ * ~ * ~ * ~ * ~ * ~ * ~ * ~ * ~ * ~ * ~ * ~ * ~ * ~ * ~ * ~ * ~ * ~ * ~
Note:
In no way is this intended as a financial/investment/trading advice. You are responsible for your own investment decisions and trades.
Please exercise your own judgement for your own trades base on your own risk-aversion level and goals as an investor or a trader. The use of OTHER indicators and analysis in conjunction (tailored to your own style of investing/trading) will help improve confidence of your analysis, for you to determine your own trade decisions.
~ * ~ * ~ * ~ * ~ * ~ * ~ * ~ * ~ * ~ * ~ * ~ * ~ * ~ * ~ * ~ * ~ * ~ * ~ * ~ * ~
Please check out my other indicators sets and series, e.g.
- LIVIDITIUM (dynamic levels),
- AEONDRIFT (multi-levels standard deviation bands),
- FUSIONGAPS (MA based oscillators),
- MAJESTIC (Momentum/Acceleration/Jerk Oscillators),
- PRISM (pSAR based oscillator, with RSI/StochRSI as well as Momentum/Acceleration/Jerk indicators),
- PDF (parabolic SAR /w HighLow Trends Indicator/Bar-color-marking + Dynamic Fib Retrace and Extension Level)
- and more to come.
Constructive feedback and suggestions are welcome.
~JuniAiko
(=^~^=)v~
Notas de Lançamento
Implemented LOG and SQRT plotting modes.Notas de Lançamento
Adjusted defaults.Notas de Lançamento
Fixed rescaling of Momentum and Acceleration plots.Notas de Lançamento
Adjusted defaults.Notas de Lançamento
Removed indicators.Notas de Lançamento
Tidied up script.Notas de Lançamento
Implemented divergences detection.Notas de Lançamento
Introduced potential parabolic behavior detection and potential Pump/Dump indicators.Notas de Lançamento
Updated Pump/Dump detection defaults.Notas de Lançamento
Improved Pump/Dump detection algo.Notas de Lançamento
Updated defaults.Notas de Lançamento
Introduced Bullish/Bearish detection when Log plot is enabled.Notas de Lançamento
Corrected bug.Notas de Lançamento
Bug Fix.Notas de Lançamento
Corrected bug in Log Plot script.Notas de Lançamento
Updated divergence defaults.Notas de Lançamento
Fixed bug in Normalization script.Notas de Lançamento
Disabled Normalization as the default.Notas de Lançamento
Disable divergence detection script when log plotting is enabled.Notas de Lançamento
Fixed divergence selection bug.Notas de Lançamento
Optimised default parameters.Script protegido
Esse script é publicada como código fechado. No entanto, você pode gerenciar suas escolhas de bate-papo. Por favor, abra suas Configurações do perfil
Aviso legal
As informações e publicações não se destinam a ser, e não constituem, conselhos ou recomendações financeiras, de investimento, comerciais ou de outro tipo fornecidos ou endossados pela TradingView. Leia mais nos Termos de Uso.
Script protegido
Esse script é publicada como código fechado. No entanto, você pode gerenciar suas escolhas de bate-papo. Por favor, abra suas Configurações do perfil
Aviso legal
As informações e publicações não se destinam a ser, e não constituem, conselhos ou recomendações financeiras, de investimento, comerciais ou de outro tipo fornecidos ou endossados pela TradingView. Leia mais nos Termos de Uso.