OPEN-SOURCE SCRIPT
HL range by durga
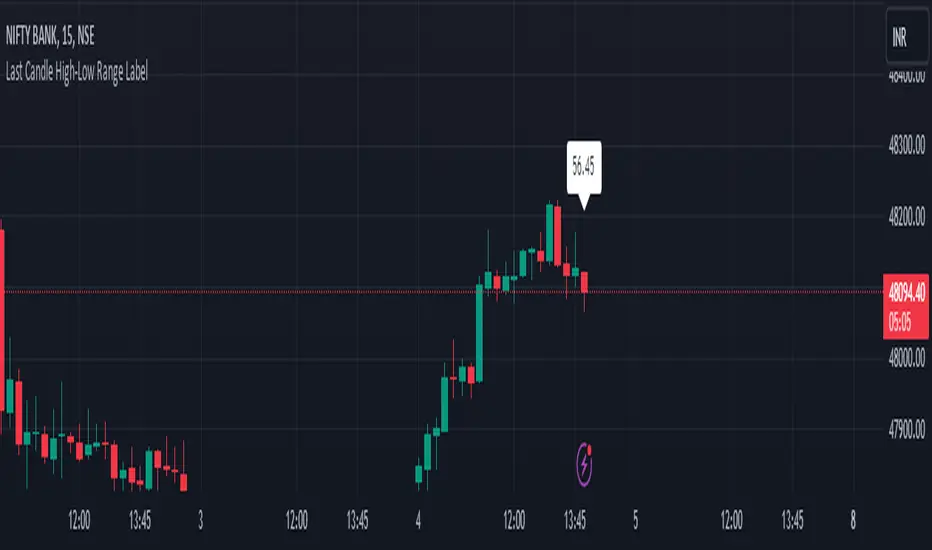
The script we've been working on is an indicator designed to display the high-low range of the last candlestick on a TradingView chart. It does so by plotting two lines: one for the high and another for the low of the last completed candlestick.
Additionally, the script includes a label that shows the numerical value of the high-low range. This label is positioned between the plotted lines, showing the difference between the high and low prices of the last candlestick.
The script operates in real-time, updating dynamically as new candlesticks form. Furthermore, it automatically removes the label after the close of the candlestick, maintaining a clean and clutter-free chart.
This indicator can help traders quickly visualize and assess the range of the last completed candlestick, aiding in their analysis of price action.
Script de código aberto
Em verdadeiro espírito do TradingView, o criador deste script o tornou de código aberto, para que os traders possam revisar e verificar sua funcionalidade. Parabéns ao autor! Embora você possa usá-lo gratuitamente, lembre-se de que a republicação do código está sujeita às nossas Regras da Casa.
Aviso legal
As informações e publicações não se destinam a ser, e não constituem, conselhos ou recomendações financeiras, de investimento, comerciais ou de outro tipo fornecidos ou endossados pela TradingView. Leia mais nos Termos de Uso.