OPEN-SOURCE SCRIPT
Multiple Ema's
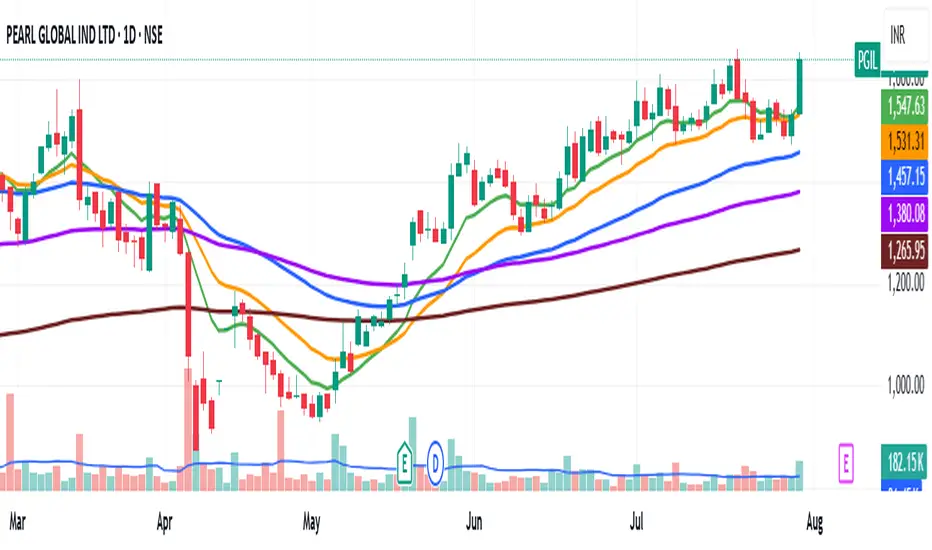
This indicator plots five customizable Exponential Moving Averages (EMAs) directly on your chart, helping you analyze price trends and identify potential support/resistance zones more effectively.
Features:
Five EMAs with adjustable lengths: Quickly set the periods for each EMA (default: 10, 20, 50, 100, 200).
Clear, color-coded lines: Each EMA is plotted with a distinct color for easy visualization:
EMA 1 (Green)
EMA 2 (Orange)
EMA 3 (Blue)
EMA 4 (Purple)
EMA 5 (Brown)
Overlay on price chart: All curves are shown directly on your main chart for seamless trend analysis.
How to Use:
Use this indicator to:
Identify short-, medium-, and long-term trends by observing the relationships and crossovers between the EMAs.
Spot momentum shifts and potential entry/exit opportunities when price crosses above or below multiple EMAs.
Fine-tune EMA periods to your own trading strategy using the input settings.
Ideal for:
Traders and investors seeking a flexible, multi-timeframe EMA solution for stocks, forex, crypto, or any market.
Tip: Experiment with EMA lengths to match your trading style or combine with other indicators for even stronger signals!
Script de código aberto
Em verdadeiro espírito do TradingView, o criador deste script o tornou de código aberto, para que os traders possam revisar e verificar sua funcionalidade. Parabéns ao autor! Embora você possa usá-lo gratuitamente, lembre-se de que a republicação do código está sujeita às nossas Regras da Casa.
Aviso legal
As informações e publicações não se destinam a ser, e não constituem, conselhos ou recomendações financeiras, de investimento, comerciais ou de outro tipo fornecidos ou endossados pela TradingView. Leia mais nos Termos de Uso.