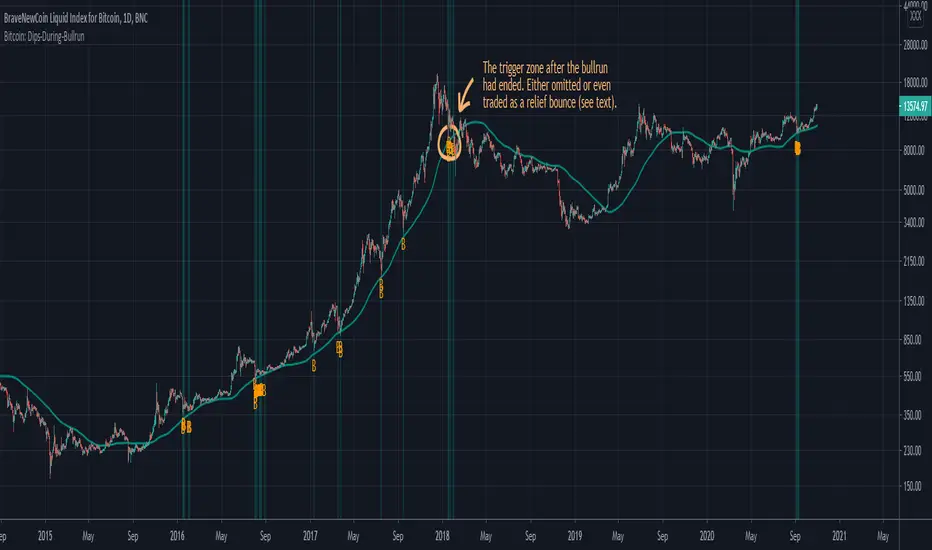
Bitcoin: Dips During Bullrun

Note that this algorithm is rather rudimentary, and it will also trigger in one more zone after the bullrun has already ended (marked on the chart above), as the first retest of the MA(20W) shows similar behaviour in the RSI as during bullrun dips. However with other indicators DeanTrader provides (as e.g. the "Bitcoin: Price Action Integrals", and the "Bitcoin: Top & Bottom Mini-Algo" indicators), it should be possible to determine when the bullrun has roughly ended to then discard this indicator until the next bull phase starts sometime in the future. Also some people might even want to trade the relief bounce based on that after-bullrun trigger.
You can hide the MA, as well as the green overlay and/or the plotted "B"s, if you only want to see some part of this indicator on your chart.
For access please contact me via DM on TradingView or on Twitter (linked on my TradingView profile and in my signature).
Script sob convite
Somente usuários aprovados pelo autor podem acessar este script. Você precisará solicitar e obter permissão para usá-lo. Normalmente, essa permissão é concedida após o pagamento. Para obter mais detalhes, siga as instruções do autor abaixo ou entre em contato diretamente com Dean_Trader.
A TradingView NÃO recomenda pagar ou usar um script, a menos que você confie totalmente em seu autor e entenda como ele funciona. Você também pode encontrar alternativas gratuitas e de código aberto em nossos scripts da comunidade.
Instruções do autor
Aviso legal
Script sob convite
Somente usuários aprovados pelo autor podem acessar este script. Você precisará solicitar e obter permissão para usá-lo. Normalmente, essa permissão é concedida após o pagamento. Para obter mais detalhes, siga as instruções do autor abaixo ou entre em contato diretamente com Dean_Trader.
A TradingView NÃO recomenda pagar ou usar um script, a menos que você confie totalmente em seu autor e entenda como ele funciona. Você também pode encontrar alternativas gratuitas e de código aberto em nossos scripts da comunidade.