CVD Line + EMA
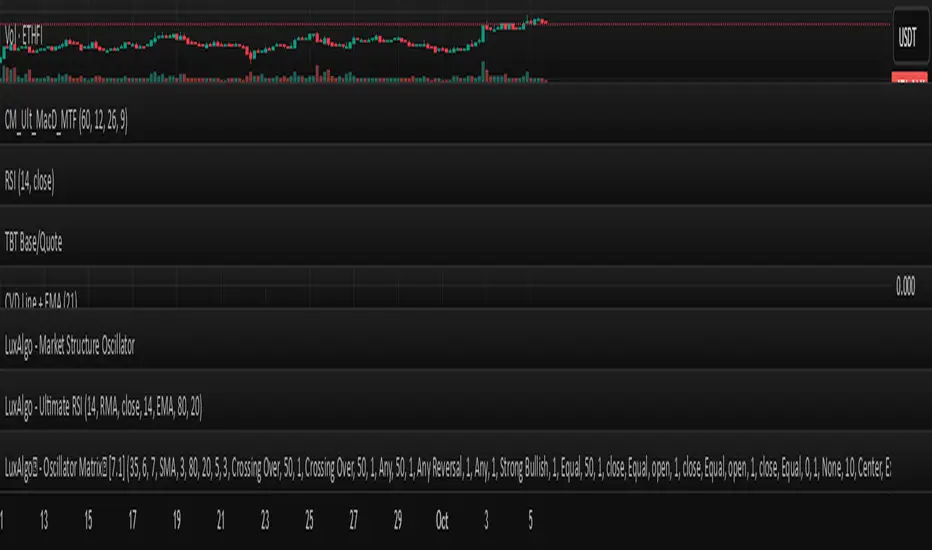
Settings allow users to customize the EMA period to suit different timeframes or trading strategies. The script is intended for educational purposes and is released under the Mozilla Public License 2.0. For best results, use in conjunction with other analysis and risk management tools.
Script sob convite
Somente usuários aprovados pelo autor podem acessar este script. Você precisará solicitar e obter permissão para usá-lo. Normalmente, essa permissão é concedida após o pagamento. Para obter mais detalhes, siga as instruções do autor abaixo ou entre em contato diretamente com MFH_BM.
O TradingView NÃO recomenda pagar ou usar um script ao não ser que você confie totalmente no seu autor e compreende como isso funciona. Você pode também encontrar alternativas gratuitas e de código aberto em nossa comunidade de scripts.
Instruções do autor
Aviso legal
Script sob convite
Somente usuários aprovados pelo autor podem acessar este script. Você precisará solicitar e obter permissão para usá-lo. Normalmente, essa permissão é concedida após o pagamento. Para obter mais detalhes, siga as instruções do autor abaixo ou entre em contato diretamente com MFH_BM.
O TradingView NÃO recomenda pagar ou usar um script ao não ser que você confie totalmente no seu autor e compreende como isso funciona. Você pode também encontrar alternativas gratuitas e de código aberto em nossa comunidade de scripts.