OPEN-SOURCE SCRIPT
Dynamic Support & Resistance Zones
Dynamic Support & Resistance Zones
Overview
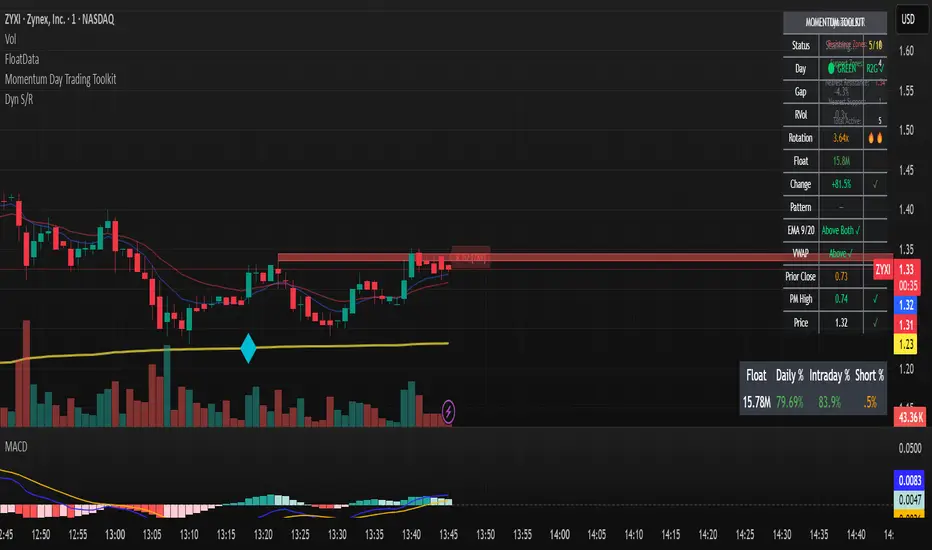
This indicator automatically detects and visualizes dynamic support and resistance zones based on pivot point analysis. Unlike simple horizontal lines, these zones adapt to market volatility using ATR and track how many times price has respected each level—giving you a real-time strength score for every zone.
How It Works
The indicator identifies swing highs and lows using pivot detection, then creates zones around these price levels. Each zone is continuously monitored for:
Touches: Every time price enters the zone and reverses, the touch count increases
Strength: A 0-100% score based on touch count and recency (zones fade over time if untested)
Breaks: When price closes beyond the zone for consecutive bars, it's marked as broken and removed
Nearby zones of the same type automatically merge to reduce clutter, and only the strongest zones are displayed based on your settings.
Features
🎯 Smart Zone Detection
Pivot-based identification of key price levels
ATR-adaptive zone width (adjusts to volatility)
Automatic merging of overlapping zones
📊 Strength Scoring System
Each zone rated 0-100% based on touches + time decay
Stronger zones appear more opaque
Weak/old zones automatically removed
🔔 Built-in Alerts
Alert when price approaches a zone
Alert when price breaks through a zone
📋 Info Panel
Shows count of active resistance/support zones
Displays nearest S/R levels above and below current price
Settings
Detection Settings
Pivot Lookback Length - Higher values find stronger but fewer levels (default: 10)
Zone Width (%) - Width of each zone as % of price (default: 0.5%)
Max Zones to Display - Limits visual clutter (default: 8)
Merge Distance (%) - Zones within this % are combined (default: 1.0%)
Zone Strength
Min Touches for Valid Zone - Zones need this many touches to display (default: 2)
Strength Decay (bars) - How quickly zones lose strength over time (default: 100)
Break Confirmation Bars - Consecutive closes needed to confirm a break (default: 2)
Visual Settings
Customize resistance/support colors
Toggle labels and strength display
Option to extend zones into the future
How to Use
For Entries:
Look for confluence when price approaches a high-strength zone (70%+)
Zones with 3+ touches have historically acted as strong reversal points
Use the "approaching zone" alert to get notified before price reaches key levels
For Exits/Targets:
Set profit targets at the nearest resistance (for longs) or support (for shorts)
The info panel shows these levels in real-time
For Breakout Trading:
Watch for breaks of high-touch zones—these often lead to momentum moves
Use the "broke zone" alert to catch breakouts as they happen
Best Practices
On higher timeframes (4H, Daily): Use higher pivot lookback (15-20) for major levels
On lower timeframes (5m, 15m): Use lower pivot lookback (5-8) for scalping levels
For volatile assets: Increase zone width to 1-2%
For ranging markets: Lower min touches to 1 to see more potential levels
Notes
Zones are drawn from the time they were created, extending right
The indicator uses timestamps (not bar indices) so it works on any history length
Broken zones are automatically cleaned up to keep your chart clear
Tip: Combine with volume analysis or momentum indicators for confirmation before trading S/R levels.
If you find this indicator useful, please leave a comment with your feedback or suggestions for improvements!
Overview
This indicator automatically detects and visualizes dynamic support and resistance zones based on pivot point analysis. Unlike simple horizontal lines, these zones adapt to market volatility using ATR and track how many times price has respected each level—giving you a real-time strength score for every zone.
How It Works
The indicator identifies swing highs and lows using pivot detection, then creates zones around these price levels. Each zone is continuously monitored for:
Touches: Every time price enters the zone and reverses, the touch count increases
Strength: A 0-100% score based on touch count and recency (zones fade over time if untested)
Breaks: When price closes beyond the zone for consecutive bars, it's marked as broken and removed
Nearby zones of the same type automatically merge to reduce clutter, and only the strongest zones are displayed based on your settings.
Features
🎯 Smart Zone Detection
Pivot-based identification of key price levels
ATR-adaptive zone width (adjusts to volatility)
Automatic merging of overlapping zones
📊 Strength Scoring System
Each zone rated 0-100% based on touches + time decay
Stronger zones appear more opaque
Weak/old zones automatically removed
🔔 Built-in Alerts
Alert when price approaches a zone
Alert when price breaks through a zone
📋 Info Panel
Shows count of active resistance/support zones
Displays nearest S/R levels above and below current price
Settings
Detection Settings
Pivot Lookback Length - Higher values find stronger but fewer levels (default: 10)
Zone Width (%) - Width of each zone as % of price (default: 0.5%)
Max Zones to Display - Limits visual clutter (default: 8)
Merge Distance (%) - Zones within this % are combined (default: 1.0%)
Zone Strength
Min Touches for Valid Zone - Zones need this many touches to display (default: 2)
Strength Decay (bars) - How quickly zones lose strength over time (default: 100)
Break Confirmation Bars - Consecutive closes needed to confirm a break (default: 2)
Visual Settings
Customize resistance/support colors
Toggle labels and strength display
Option to extend zones into the future
How to Use
For Entries:
Look for confluence when price approaches a high-strength zone (70%+)
Zones with 3+ touches have historically acted as strong reversal points
Use the "approaching zone" alert to get notified before price reaches key levels
For Exits/Targets:
Set profit targets at the nearest resistance (for longs) or support (for shorts)
The info panel shows these levels in real-time
For Breakout Trading:
Watch for breaks of high-touch zones—these often lead to momentum moves
Use the "broke zone" alert to catch breakouts as they happen
Best Practices
On higher timeframes (4H, Daily): Use higher pivot lookback (15-20) for major levels
On lower timeframes (5m, 15m): Use lower pivot lookback (5-8) for scalping levels
For volatile assets: Increase zone width to 1-2%
For ranging markets: Lower min touches to 1 to see more potential levels
Notes
Zones are drawn from the time they were created, extending right
The indicator uses timestamps (not bar indices) so it works on any history length
Broken zones are automatically cleaned up to keep your chart clear
Tip: Combine with volume analysis or momentum indicators for confirmation before trading S/R levels.
If you find this indicator useful, please leave a comment with your feedback or suggestions for improvements!
Script de código aberto
Em verdadeiro espírito do TradingView, o criador deste script o tornou de código aberto, para que os traders possam revisar e verificar sua funcionalidade. Parabéns ao autor! Embora você possa usá-lo gratuitamente, lembre-se de que a republicação do código está sujeita às nossas Regras da Casa.
Dr. Trader MD PhD
Aviso legal
As informações e publicações não se destinam a ser, e não constituem, conselhos ou recomendações financeiras, de investimento, comerciais ou de outro tipo fornecidos ou endossados pela TradingView. Leia mais nos Termos de Uso.