PROTECTED SOURCE SCRIPT
Atualizado GTA MARKET SENTIMENT
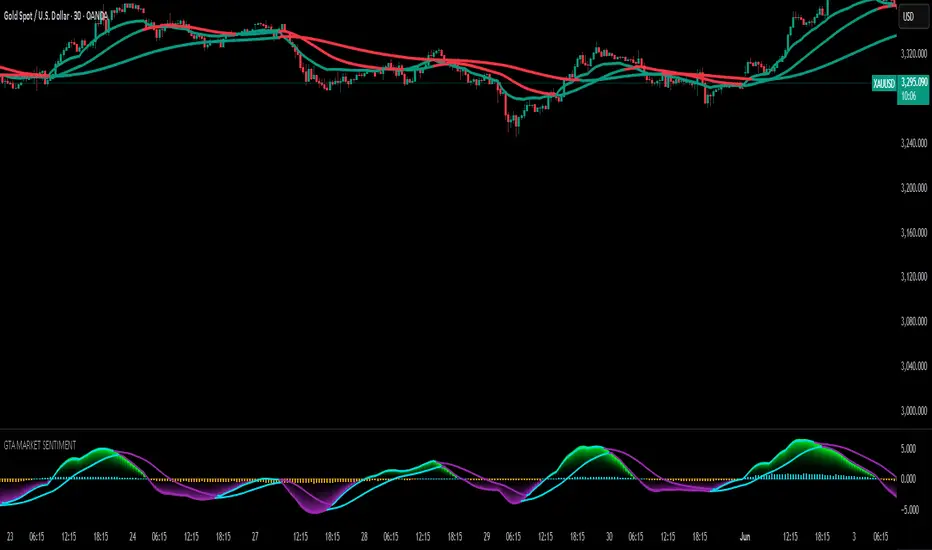
GTA Market Sentiment Indicator – Multi-Timeframe Momentum Analysis
Technical Overview
The GTA Market Sentiment indicator is a multi-timeframe momentum analysis tool that calculates trend strength and directional bias by aggregating data from higher timeframes. It applies a timeframe multiplier to derive price data from three progressively larger timeframes, providing a broader perspective on market conditions.
Key Components:
Multi-Timeframe Data Aggregation:
Uses a timeframe multiplier to fetch price data from three higher timeframes.
Computes an averaged price input to smoothen noise and enhance trend clarity.
Exponential Moving Averages (EMAs):
Two EMAs (fast and slow) are calculated on the multi-timeframe aggregated price.
A signal line is derived using an additional EMA to track momentum shifts.
Histogram Representation:
Displays the difference between the moving averages as a histogram.
Implements a gradient color fill to visually indicate trend shifts.
Histogram color intensity adapts dynamically to signal strength variations.
Slope Calculation:
Computes the slope of the aggregated momentum data to assess trend strength.
Helps detect acceleration or deceleration in trend movement.
Zero Line & Signal Levels:
Zero line acts as a baseline for trend bias determination.
Additional signal levels provide reference points for potential trend shifts.
Customization & Parameters:
Time Frame Multiplier: Adjustable multiplier for selecting higher timeframes.
Fast, Slow, and Signal Lengths: User-defined parameters to modify responsiveness.
Moving Average Display Toggle: Option to enable or disable visualization of EMAs.
Usage Considerations:
Designed for multi-timeframe confirmation and momentum-based trend assessment.
Suitable for analyzing trend consistency across different time horizons.
Can be combined with other technical tools for deeper market context.
This indicator provides a structured approach to momentum analysis by leveraging multiple timeframes, smoothing out short-term noise, and offering a clearer visualization of trend dynamics.
Notas de Lançamento
In this update, the trend has been further smoothed by incorporating calculated EMA, and both major and minor trend lines have been added to provide clearer market direction. The sentiment analysis has been enhanced with more depth, and repainting has been significantly reduced for improved reliability.Script protegido
Esse script é publicada como código fechado. No entanto, você pode gerenciar suas escolhas de bate-papo. Por favor, abra suas Configurações do perfil
Aviso legal
As informações e publicações não se destinam a ser, e não constituem, conselhos ou recomendações financeiras, de investimento, comerciais ou de outro tipo fornecidos ou endossados pela TradingView. Leia mais nos Termos de Uso.
Script protegido
Esse script é publicada como código fechado. No entanto, você pode gerenciar suas escolhas de bate-papo. Por favor, abra suas Configurações do perfil
Aviso legal
As informações e publicações não se destinam a ser, e não constituem, conselhos ou recomendações financeiras, de investimento, comerciais ou de outro tipo fornecidos ou endossados pela TradingView. Leia mais nos Termos de Uso.