OPEN-SOURCE SCRIPT
VixFix RVol + EMA
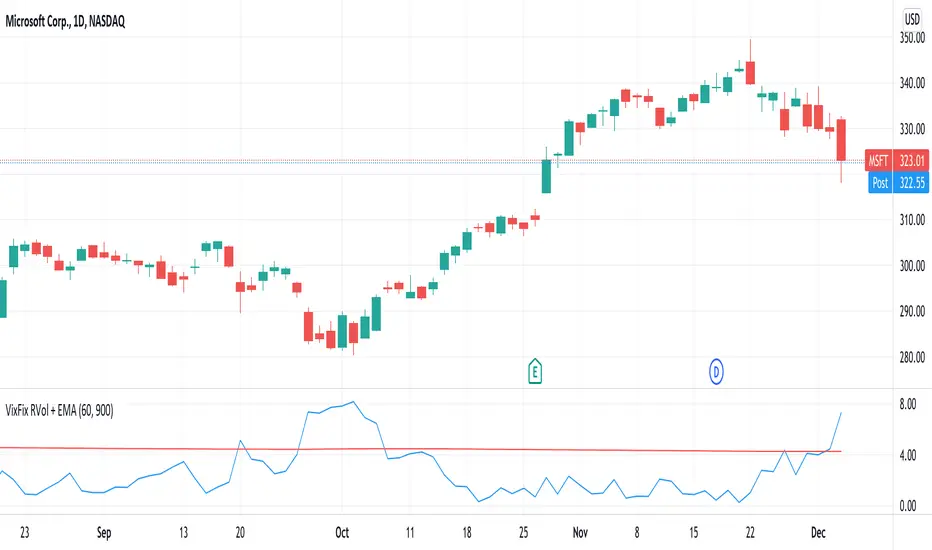
This indicator plots Realised Volatility (measured using VixFix method) against its long-term exponential moving average.
RVol breaking above its EMA = Sell signal
RVol breaking below its EMA = Buy signal
60-day VixFix look back period and 900 day EMA work well for lower volatility tickers (equity ETFs, megacap stocks). Higher volatility tickers could benefit from shorter look back period and EMA.
RVol breaking above its EMA = Sell signal
RVol breaking below its EMA = Buy signal
60-day VixFix look back period and 900 day EMA work well for lower volatility tickers (equity ETFs, megacap stocks). Higher volatility tickers could benefit from shorter look back period and EMA.
Script de código aberto
Em verdadeiro espírito do TradingView, o criador deste script o tornou de código aberto, para que os traders possam revisar e verificar sua funcionalidade. Parabéns ao autor! Embora você possa usá-lo gratuitamente, lembre-se de que a republicação do código está sujeita às nossas Regras da Casa.
Aviso legal
As informações e publicações não se destinam a ser, e não constituem, conselhos ou recomendações financeiras, de investimento, comerciais ou de outro tipo fornecidos ou endossados pela TradingView. Leia mais nos Termos de Uso.