PROTECTED SOURCE SCRIPT
Atualizado Mean Reversion Indicator
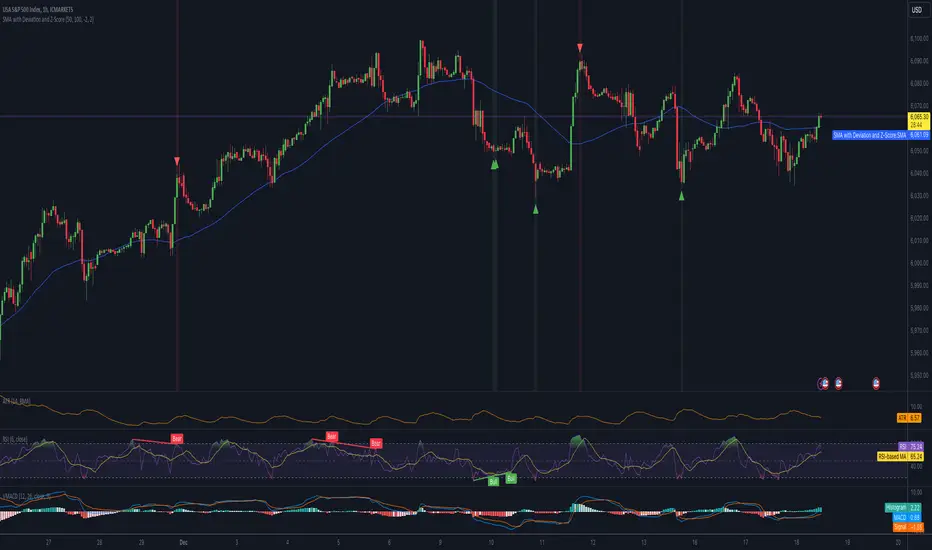
SMA with Deviation and Z-Score Indicator
Overview:
This indicator combines the Simple Moving Average (SMA) with statistical measures of price deviation to identify potential buy and sell signals based on mean reversion principles. It calculates the Z-Score, which quantifies how far the current price is from its moving average in terms of standard deviations, helping traders spot when an asset might be overbought or oversold.
Key Features:
Signal Generation:
Visual Indicators:
Customizable Parameters:

 EURUSD EURUSD
Usage Tips:
This indicator is best used in conjunction with other forms of analysis for confirmation. Mean reversion does not always hold in trending markets.
Adjust the Z-Score thresholds based on asset volatility for more or less frequent signals.
Backtest with historical data to optimize settings for your specific trading approach.
Note: While this indicator can help identify potential trading opportunities based on statistical anomalies, it does not guarantee success and should be part of a broader trading strategy that includes risk management and market context understanding.
Overview:
This indicator combines the Simple Moving Average (SMA) with statistical measures of price deviation to identify potential buy and sell signals based on mean reversion principles. It calculates the Z-Score, which quantifies how far the current price is from its moving average in terms of standard deviations, helping traders spot when an asset might be overbought or oversold.
Key Features:
SMA Calculation: Uses a user-defined period to compute a Simple Moving Average, providing a baseline for price movement.
Z-Score: Measures the number of standard deviations the current price is from the SMA. This is crucial for identifying extreme price movements.
Formula: Z-Score = (Current Price - SMA) / Standard Deviation
Signal Generation:
Buy Signal: Generated when the Z-Score falls below a predefined threshold, suggesting the price is significantly below its mean and potentially undervalued.
Sell Signal: Triggered when the Z-Score exceeds another threshold, indicating the price is significantly above its mean and possibly overvalued.
Visual Indicators:
SMA Line: Plotted in blue on the chart for easy reference.
Z-Score Line: Available but hidden by default, can be shown if needed for deeper analysis.
Buy/Sell Signals: Represented by green up-arrows for buy signals and red down-arrows for sell signals.
Background Color: Changes to green or red subtly to indicate buy or sell zones based on Z-Score thresholds.
Z-Score Label: Provides the numerical Z-Score for each bar, aiding in precise decision-making.
Customizable Parameters:
SMA Length: Adjust the period over which the SMA is calculated.
Lookback Period: Set the number of periods for calculating the standard deviation and Z-Score.
Buy/Sell Z-Scores: Thresholds for generating buy and sell signals can be tailored to your strategy or market conditions.
Usage Tips:
This indicator is best used in conjunction with other forms of analysis for confirmation. Mean reversion does not always hold in trending markets.
Adjust the Z-Score thresholds based on asset volatility for more or less frequent signals.
Backtest with historical data to optimize settings for your specific trading approach.
Note: While this indicator can help identify potential trading opportunities based on statistical anomalies, it does not guarantee success and should be part of a broader trading strategy that includes risk management and market context understanding.
Notas de Lançamento
SMA with Deviation and Z-Score IndicatorOverview:
This indicator combines the Simple Moving Average (SMA) with statistical measures of price deviation to identify potential buy and sell signals based on mean reversion principles. It calculates the Z-Score, which quantifies how far the current price is from its moving average in terms of standard deviations, helping traders spot when an asset might be overbought or oversold.
Key Features:
SMA Calculation: Uses a user-defined period to compute a Simple Moving Average, providing a baseline for price movement.
Z-Score: Measures the number of standard deviations the current price is from the SMA. This is crucial for identifying extreme price movements.
Formula: Z-Score = (Current Price - SMA) / Standard Deviation
Signal Generation:
Buy Signal: Generated when the Z-Score falls below a predefined threshold, suggesting the price is significantly below its mean and potentially undervalued.
Sell Signal: Triggered when the Z-Score exceeds another threshold, indicating the price is significantly above its mean and possibly overvalued.
Visual Indicators:
SMA Line: Plotted in blue on the chart for easy reference.
Z-Score Line: Available but hidden by default, can be shown if needed for deeper analysis.
Buy/Sell Signals: Represented by green up-arrows for buy signals and red down-arrows for sell signals.
Background Color: Changes to green or red subtly to indicate buy or sell zones based on Z-Score thresholds.
Z-Score Label: Provides the numerical Z-Score for each bar, aiding in precise decision-making.
Customizable Parameters:
SMA Length: Adjust the period over which the SMA is calculated.
Lookback Period: Set the number of periods for calculating the standard deviation and Z-Score.
Buy/Sell Z-Scores: Thresholds for generating buy and sell signals can be tailored to your strategy or market conditions.
Usage Tips:
This indicator is best used in conjunction with other forms of analysis for confirmation. Mean reversion does not always hold in trending markets.
Adjust the Z-Score thresholds based on asset volatility for more or less frequent signals.
Backtest with historical data to optimize settings for your specific trading approach.
Note: While this indicator can help identify potential trading opportunities based on statistical anomalies, it does not guarantee success and should be part of a broader trading strategy that includes risk management and market context understanding.
Script protegido
Esse script é publicada como código fechado. No entanto, você pode gerenciar suas escolhas de bate-papo. Por favor, abra suas Configurações do perfil
Aviso legal
As informações e publicações não se destinam a ser, e não constituem, conselhos ou recomendações financeiras, de investimento, comerciais ou de outro tipo fornecidos ou endossados pela TradingView. Leia mais nos Termos de Uso.