OPEN-SOURCE SCRIPT
Atualizado [blackcat] L3 Gann B-Xtrender
Level 3
Background
The Gann Slope indicator has been welcomed by the community since its release, and many people are trying to integrate it into their trading systems. One of these is the need to integrate Gann Slope into QuantTherapy's B-Xtrender @Puppytherapy.
Function

You can find QuantTherapy's script above , he recreated a trend following indicator published in IFTA Journal by Bharat Jhunjhunwala. It is mainly to be traded on big timeframes.
As requested, i replaced the oscillator part with my Gann slope oscillator. However, I found the setting for input parameters for B-Xtrender is rather complex, you need to take great care to tuning them for specific time frame and trading pairs. Pls don't be lazy to apply this indicator to your chart and expect good results. You have to try and find proper values of them to obtain acceptable results.
Remarks
Feedbacks are appreciated.
Background
The Gann Slope indicator has been welcomed by the community since its release, and many people are trying to integrate it into their trading systems. One of these is the need to integrate Gann Slope into QuantTherapy's B-Xtrender @Puppytherapy.
Function
You can find QuantTherapy's script above , he recreated a trend following indicator published in IFTA Journal by Bharat Jhunjhunwala. It is mainly to be traded on big timeframes.
As requested, i replaced the oscillator part with my Gann slope oscillator. However, I found the setting for input parameters for B-Xtrender is rather complex, you need to take great care to tuning them for specific time frame and trading pairs. Pls don't be lazy to apply this indicator to your chart and expect good results. You have to try and find proper values of them to obtain acceptable results.
Remarks
Feedbacks are appreciated.
Notas de Lançamento
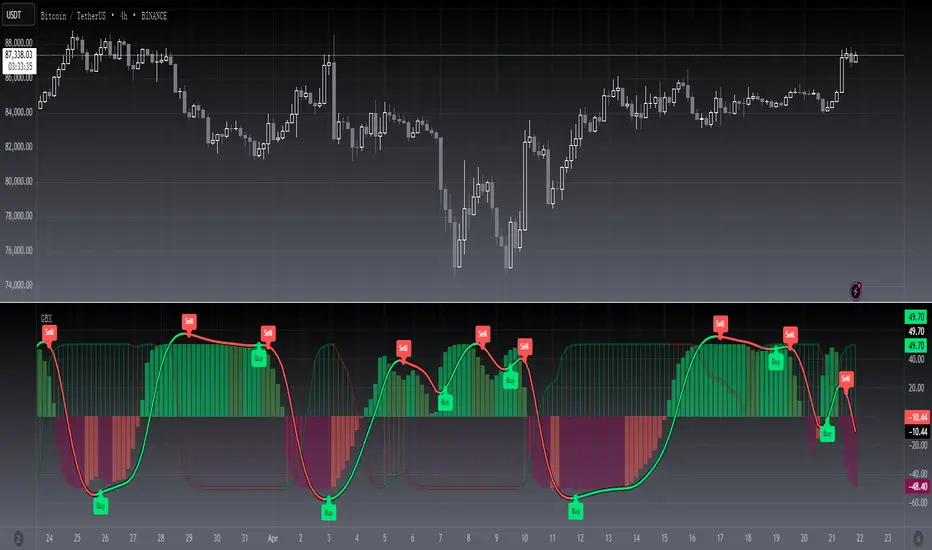
OVERVIEWThe [blackcat] L3 Gann B-Xtrender indicator integrates sophisticated technical analysis methods derived from W.D. Gann’s theories along with modern trend-following strategies. By calculating both short-term and long-term Xtrender values through customized algorithms, this tool provides traders with detailed insights into market dynamics. The indicator visually represents these values via histograms and moving averages, making it easier to identify potential buying and selling points. Whether you are a day trader looking for quick reversals or a swing trader aiming for broader trends, this indicator offers valuable information to enhance your decision-making process 📊✅.
FEATURES
Advanced Gann Slope Calculation:
Utilizes highs and lows over user-defined periods to compute the Gann slope.
Helps in identifying underlying trends and momentum shifts in the market.
Dual-Time Frame Analysis:
Short-Term Xtrender: Focuses on immediate market movements using shorter EMA periods.
Long-Term Xtrender: Analyzes broader trends with longer EMA settings for a macro perspective.
Visual Representation:
Colored Histograms: Indicate the intensity and direction of trends.
Green/Lime colors signify bullish trends.
Red/Maroon colors denote bearish trends.
Moving Averages: Provide smoothed trend lines for clearer signal interpretation.
Plot Shapes: Circles highlight key reversal points for enhanced visibility.
Customizable Parameters:
Fine-tune the sensitivity of the indicator with adjustable inputs for both short-term and long-term analyses.
Tailor the indicator to match specific trading styles and preferences.
Dynamic Labels:
Automatically generates 'Buy' and 'Sell' labels at critical junctures.
Offers clear entry and exit points directly on the chart for swift decision-making 🎯.
HOW TO USE
Adding the Indicator:
Access your TradingView platform and navigate to the indicators section.
Select '[blackcat] L3 Gann B-Xtrender' from the list and add it to your desired chart.
Adjusting Input Parameters:
Modify the following inputs according to your trading strategy:
Short - L1, L2, L3: Define the lengths for short-term calculations.
Long - L1, L2: Set the lengths for long-term calculations.
Experiment with different combinations to find what works best for your trading style.
Interpreting the Chart:
Histograms: Look for green/lime bars for bullish trends and red/maroon bars for bearish trends.
Lines: Follow the moving average lines to understand the overall trend direction.
Circles: Pay attention to the small circles which mark significant turning points.
Utilizing Buy/Sell Signals:
When a 'Buy' label appears, consider entering a long position.
Conversely, when a 'Sell' label shows up, think about exiting or going short.
Always confirm these signals with other analytical tools for better reliability.
Combining with Other Indicators:
For a robust trading strategy, integrate this indicator with volume profiles, support/resistance levels, and other oscillators.
This multi-layered approach can significantly improve the accuracy of your trades.
Setting Alerts:
Configure alerts within TradingView to notify you whenever new buy/sell conditions arise.
Stay informed even when away from your screen, ensuring timely execution of trades.
Backtesting and Optimization:
Before deploying the indicator in real-time trading, backtest its performance across various assets and timeframes.
Optimize the parameters based on historical data to maximize profitability and minimize risk.
LIMITATIONS
Market Volatility: In extremely volatile or sideways markets, the indicator might produce false signals due to erratic price movements 🌪️.
Confirmation Needed: Relying solely on this indicator without cross-verification from other tools could lead to suboptimal results.
Asset-Specific Performance: The efficacy of the indicator varies depending on the type of asset and chosen timeframe; thorough testing is essential.
NOTES
Data Sufficiency: Ensure ample historical data is available for precise computations and reliable trend detection.
Demo Testing: Rigorously test the indicator on demo accounts to gauge its effectiveness under simulated market conditions.
Parameter Tuning: Regularly review and adjust the input parameters to adapt to changing market environments and evolving trading needs.
Script de código aberto
Em verdadeiro espírito do TradingView, o criador deste script o tornou de código aberto, para que os traders possam revisar e verificar sua funcionalidade. Parabéns ao autor! Embora você possa usá-lo gratuitamente, lembre-se de que a republicação do código está sujeita às nossas Regras da Casa.
Avoid losing contact!Don't miss out! The first and most important thing to do is to join my Discord chat now! Click here to start your adventure: discord.com/invite/ZTGpQJq 防止失联,请立即行动,加入本猫聊天群: discord.com/invite/ZTGpQJq
Aviso legal
As informações e publicações não se destinam a ser, e não constituem, conselhos ou recomendações financeiras, de investimento, comerciais ou de outro tipo fornecidos ou endossados pela TradingView. Leia mais nos Termos de Uso.