OPEN-SOURCE SCRIPT
Triple Stochastic
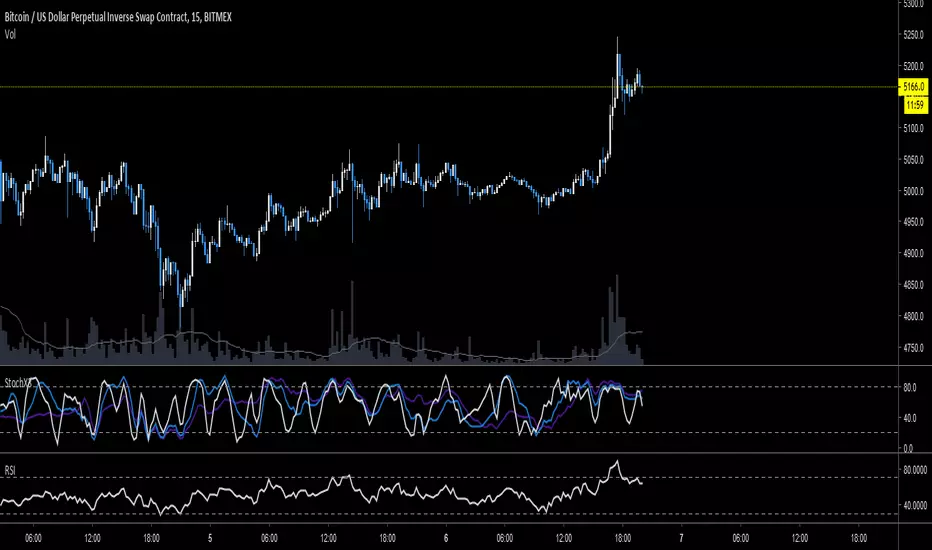
3 stochastic K-lines with short, medium & long periods & the D-lines removed.
Provides a good indication of where you are in the current supply/demand cycle & I find it helpful for timing entries.
Look for peaks & valleys formed by 2 or 3 lines, & entry would be when they start to turn around.
Try it on multiple timeframes & of course use confluence with other indicators & data.
Script de código aberto
Em verdadeiro espírito do TradingView, o criador deste script o tornou de código aberto, para que os traders possam revisar e verificar sua funcionalidade. Parabéns ao autor! Embora você possa usá-lo gratuitamente, lembre-se de que a republicação do código está sujeita às nossas Regras da Casa.
Aviso legal
As informações e publicações não se destinam a ser, e não constituem, conselhos ou recomendações financeiras, de investimento, comerciais ou de outro tipo fornecidos ou endossados pela TradingView. Leia mais nos Termos de Uso.