OPEN-SOURCE SCRIPT
Atualizado Daily Chart ATR & Movement %
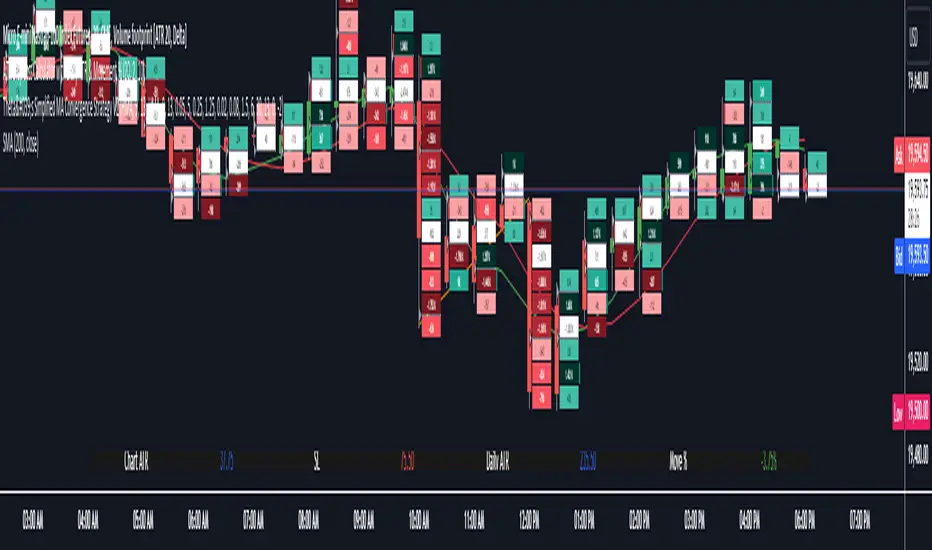
This Pine Script, titled "Daily ATR & Movement %," is designed for traders looking to gauge volatility and price movements relative to that volatility directly on their trading chart. The script calculates and displays the Average True Range (ATR) over a 14-day period using daily data, alongside the percentage movement of the current price from the previous day's close, scaled by the ATR. These metrics provide a snapshot of daily volatility and the magnitude of price movements within that context, which can be crucial for making informed trading decisions, especially in markets where volatility is a significant factor.
Key Features:
How to Use:
Setup: Apply the indicator to any chart.
Customization: Adjust the label size and vertical position to suit your viewing preference using the script’s input options.
Interpretation: Monitor the displayed ATR value and movement percentage to assess volatility and relative price movements. High percentages could indicate significant moves worth trading, while low percentages suggest minor changes.
This script is particularly useful for traders who rely on volatility-based trading strategies, such as breakout trading, where understanding the context of price movements relative to typical market fluctuations can provide a strategic edge.
Key Features:
- Daily ATR Calculation: Utilizes the ta.atr(14) function to compute the Average True Range on a daily basis, which measures market volatility by decomposing the entire range of asset prices for that day.
- Movement Percentage: The script calculates the movement from yesterday’s closing price to today’s current price as a percentage of the daily ATR. This shows how significant today's price change is relative to the typical daily volatility, which helps in understanding whether the price movement is substantial or trivial.
- Customizable Label Display: Traders can customize the display through a user input dropdown menu for label size ("small", "normal", "large", "huge") and a slider for vertical offset. This allows for better visibility and customization based on user preference and screen setup.
- Dynamic Label Updates: A label is dynamically updated each bar with the latest ATR value and movement percentage. This ongoing update keeps traders informed in real-time without manual recalculations.
How to Use:
Setup: Apply the indicator to any chart.
Customization: Adjust the label size and vertical position to suit your viewing preference using the script’s input options.
Interpretation: Monitor the displayed ATR value and movement percentage to assess volatility and relative price movements. High percentages could indicate significant moves worth trading, while low percentages suggest minor changes.
This script is particularly useful for traders who rely on volatility-based trading strategies, such as breakout trading, where understanding the context of price movements relative to typical market fluctuations can provide a strategic edge.
Notas de Lançamento
Updates to width paddingScript de código aberto
Em verdadeiro espírito do TradingView, o criador deste script o tornou de código aberto, para que os traders possam revisar e verificar sua funcionalidade. Parabéns ao autor! Embora você possa usá-lo gratuitamente, lembre-se de que a republicação do código está sujeita às nossas Regras da Casa.
Aviso legal
As informações e publicações não se destinam a ser, e não constituem, conselhos ou recomendações financeiras, de investimento, comerciais ou de outro tipo fornecidos ou endossados pela TradingView. Leia mais nos Termos de Uso.
Script de código aberto
Em verdadeiro espírito do TradingView, o criador deste script o tornou de código aberto, para que os traders possam revisar e verificar sua funcionalidade. Parabéns ao autor! Embora você possa usá-lo gratuitamente, lembre-se de que a republicação do código está sujeita às nossas Regras da Casa.
Aviso legal
As informações e publicações não se destinam a ser, e não constituem, conselhos ou recomendações financeiras, de investimento, comerciais ou de outro tipo fornecidos ou endossados pela TradingView. Leia mais nos Termos de Uso.