OPEN-SOURCE SCRIPT
Correlation Oscillator - Anomaly Alerts
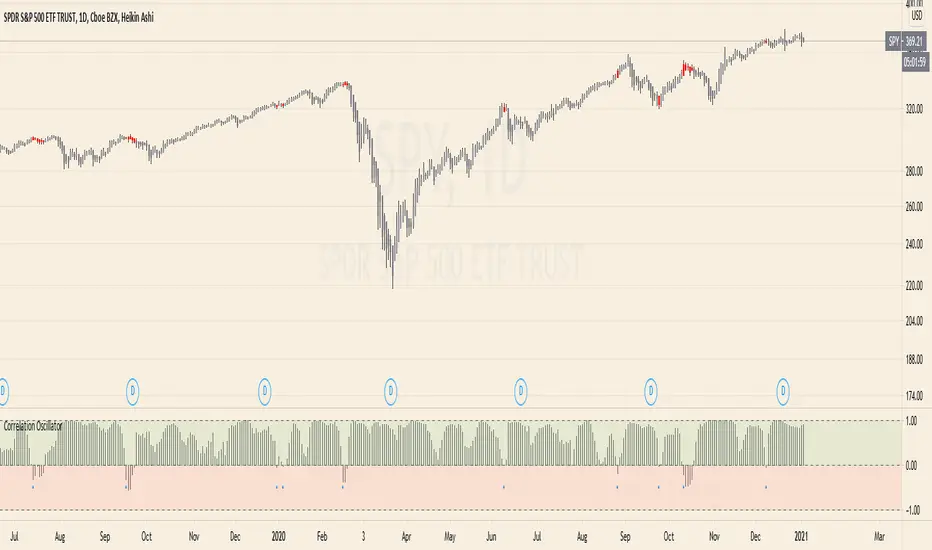
This script plots the correlation for two symbols as an oscillator:
A correlation of 1 means that both values move in the same direction together.
A correlation of -1 means that both values are perfectly negative correlated.
Parameter:
Length of the Correlation
The two symbols you want to calculate the correlation for
Barcolor: Defines whether Bar-coloring is set on.
The Number of bars lookback for anomaly: Say both are normally positively correlated it is an anomaly when the correlation turns negative and vica-versa.
Alerts: You can also set an Alert when an anomaly is detected.(blue dots on oscillator)
This has many use-cases:
For example VVIX and VIX are normally positive correlated.
When this turns negative, this can mean that we are on a turning point:
--> VVIX is rising while VIX is falling, risk of future Volatility is increasing (Top)
--> VIX is rising while VVIX is falling, risk of future Volatility is decreasing (Bottom)
Another use-case is just checking the correlation of stocks in your portfolio to diversify.
Script de código aberto
Em verdadeiro espírito do TradingView, o criador deste script o tornou de código aberto, para que os traders possam revisar e verificar sua funcionalidade. Parabéns ao autor! Embora você possa usá-lo gratuitamente, lembre-se de que a republicação do código está sujeita às nossas Regras da Casa.
Aviso legal
As informações e publicações não se destinam a ser, e não constituem, conselhos ou recomendações financeiras, de investimento, comerciais ou de outro tipo fornecidos ou endossados pela TradingView. Leia mais nos Termos de Uso.