PROTECTED SOURCE SCRIPT
Market Divergence (Line version) ©MBYLAB
Good morning.
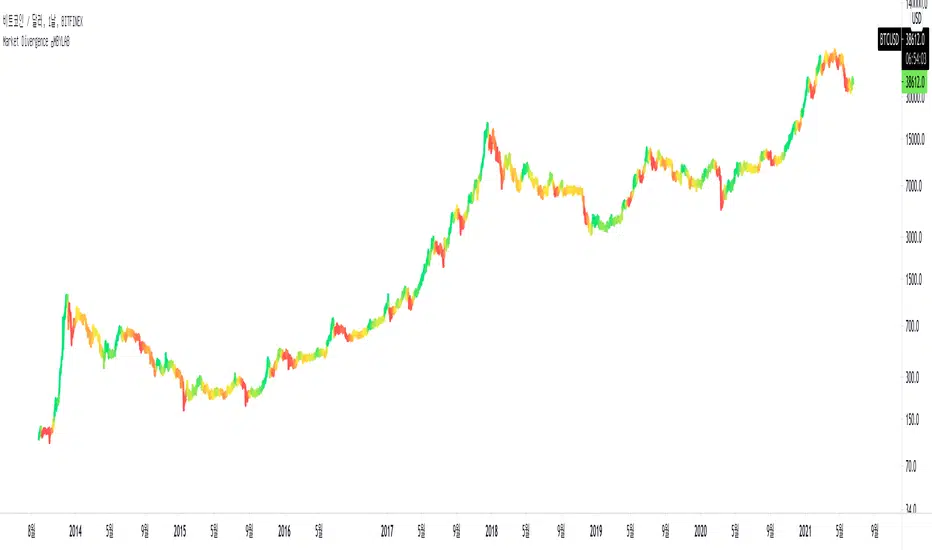
This indicator measures the distance between the moving average line and the current price position, so you can check the price divergence.
logic
In general, when the closing price breaks below the moving average and closes, it can be interpreted as downward divergence.
Based on the logic described above, this indicator will have a darker color as the current price position is further away from the set moving average.
When this indicator starts changing from red to yellow, it can be interpreted that the trend is reversing.(Bearish -> Bullish)
How to use
First, set the existing candle chart in the upper left to invisible and then apply the corresponding indicator.
Anyone can use this indicator, no special conditions are required.
Script protegido
Esse script é publicada como código fechado. No entanto, você pode gerenciar suas escolhas de bate-papo. Por favor, abra suas Configurações do perfil
Hi, im Quant from KR
Aviso legal
As informações e publicações não se destinam a ser, e não constituem, conselhos ou recomendações financeiras, de investimento, comerciais ou de outro tipo fornecidos ou endossados pela TradingView. Leia mais nos Termos de Uso.