OPEN-SOURCE SCRIPT
Myx.Mir_ Trd.Period c/w Background Color
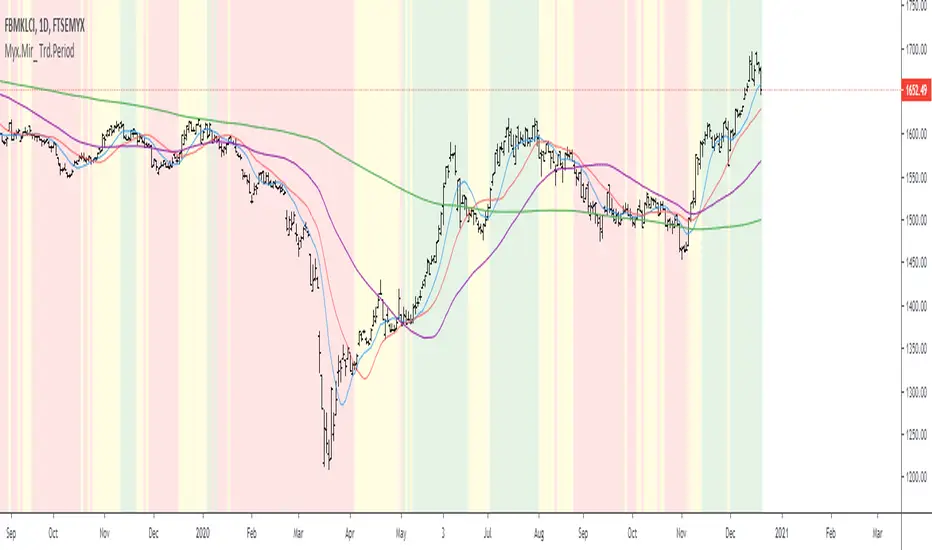
Myx.Mir_ Trd.Period c/w Background Color
FBMKLCI is a main Indices/ references
Basis = Based on Simple Moving Average
Note:-
BG= Background Color
Based on personal study:-
BG is Green = Current index > MA 20 > MA 50 = Sign of Bullish // majority portfolio should be in green & make profit... Hehehe
BG is Yellow = MA50 < Current Index < MA 20 = No solid direction and/or sideways // ----------------------------------------------------... should plan to hold or exit
BG is Red = Current Index < MA 50 = Sign of Bearish // majority of portfolio should be in red... Hehehe. Should be run Fast Fast.....
can do your own Trade Record Based on 3 phases [BG Green, Yellow, Red]
a) When the strategy/ Technique are perform better @ more gain and Don't chase the price ... "nanti asal Kejar Pucuks Je price terus Droppp..." Hehe.
b) When the strategy / Technique not perform well...
Script de código aberto
Em verdadeiro espírito do TradingView, o criador deste script o tornou de código aberto, para que os traders possam revisar e verificar sua funcionalidade. Parabéns ao autor! Embora você possa usá-lo gratuitamente, lembre-se de que a republicação do código está sujeita às nossas Regras da Casa.
Aviso legal
As informações e publicações não se destinam a ser, e não constituem, conselhos ou recomendações financeiras, de investimento, comerciais ou de outro tipo fornecidos ou endossados pela TradingView. Leia mais nos Termos de Uso.