PROTECTED SOURCE SCRIPT
Atualizado MomentumQ Momentum ROC
MomentumQ Momentum Rate of Change (ROC) Indicator
The MomentumQ Momentum ROC Indicator is a powerful and user-friendly tool designed to measure the speed and strength of price momentum. By calculating the percentage change in price over a customizable period, this indicator helps traders identify trend shifts and market momentum with ease.
How It Works:
Rate of Change (ROC) Calculation:
Moving Average Smoothing:
Zero-Level Reference Line:
Key Features:
Customizable Input Parameters:
Intuitive Visualization:
Momentum-Based Trading Signals:
User-Friendly Input Options:
Concepts and Calculations:
Momentum Rate of Change (ROC):
ROC = ((Close - Close[n]) / Close[n]) * 100
where n is the selected ROC period.
Simple Moving Average (SMA) of ROC:
How to Use:
Use the insights to refine your entries and exits in trades.
Why It’s Useful:
Identifies Trend Strength – Helps detect early momentum shifts.
Confirms Trend Reversals – Zero-line crossovers can indicate changes in direction.
Works Across Multiple Markets – Stocks, Forex, Crypto, Commodities.
Customizable & Easy to Use – Adjustable settings for different strategies.
Use the MomentumQ Momentum ROC Indicator to gain deeper insights into market momentum and improve your trading decisions.
The MomentumQ Momentum ROC Indicator is a powerful and user-friendly tool designed to measure the speed and strength of price momentum. By calculating the percentage change in price over a customizable period, this indicator helps traders identify trend shifts and market momentum with ease.
How It Works:
Rate of Change (ROC) Calculation:
- Measures the percentage price change over a specified period (default: 14).
- Helps traders determine whether an asset's momentum is increasing or decreasing.
Moving Average Smoothing:
- A Simple Moving Average (SMA) is applied to the ROC for better trend visualization.
- This helps filter out market noise and highlights sustained momentum trends.
Zero-Level Reference Line:
- A dashed horizontal line at 0% provides a clear reference point for momentum shifts.
- Above 0%: Indicates positive momentum (potential uptrend).
- Below 0%: Indicates negative momentum (potential downtrend).
Key Features:
Customizable Input Parameters:
- Adjust the ROC period (default: 14) to analyze short- or long-term momentum.
- Modify the SMA period (default: 10) for smoother trend identification.
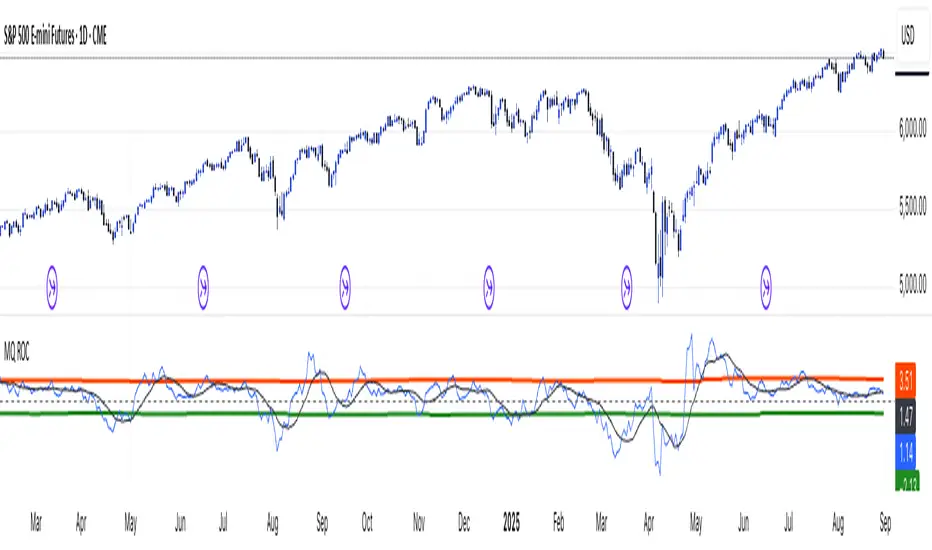
Intuitive Visualization:
- Blue Line: Represents the Rate of Change (ROC) to track momentum shifts.
- White Line: Represents the SMA of ROC, helping traders see long-term momentum.
- Gray Dashed Line: A fixed reference at 0% for trend interpretation.
Momentum-Based Trading Signals:
- Rising ROC: Increasing momentum, potential breakout.
- Falling ROC: Weakening momentum, possible reversal.
- ROC Crossing Zero: Signals a possible trend change.
User-Friendly Input Options:
- Grouped settings menu for an intuitive setup experience.
- Tooltips included to help traders understand each parameter.
Concepts and Calculations:
Momentum Rate of Change (ROC):
ROC = ((Close - Close[n]) / Close[n]) * 100
where n is the selected ROC period.
Simple Moving Average (SMA) of ROC:
- Smooths ROC fluctuations for clearer trend insights.
How to Use:
- Open the indicator settings.
- Customize the ROC period (14 by default).
- Enable and adjust the SMA period for smoothing (default: 10).
- Analyze the plotted ROC and its SMA in relation to the zero line:
- ROC > 0: Momentum is positive (uptrend).
- ROC < 0: Momentum is negative (downtrend).
- ROC rising or falling: Indicates strengthening or weakening momentum.
Use the insights to refine your entries and exits in trades.
Why It’s Useful:
Identifies Trend Strength – Helps detect early momentum shifts.
Confirms Trend Reversals – Zero-line crossovers can indicate changes in direction.
Works Across Multiple Markets – Stocks, Forex, Crypto, Commodities.
Customizable & Easy to Use – Adjustable settings for different strategies.
Use the MomentumQ Momentum ROC Indicator to gain deeper insights into market momentum and improve your trading decisions.
Notas de Lançamento
Update – V1.1Made small design improvements:
- Added light/dark mode option for better theme compatibility.
- Updated colors for ROC, MA, and pivot levels for clearer visibility.
- Slightly refined overall chart appearance (no changes to core logic).
Please remove the indicator and add it again to load the update.
Feel free to share feedback if anything still needs improvement.
Notas de Lançamento
Updated the chart. Script protegido
Esse script é publicada como código fechado. No entanto, você pode gerenciar suas escolhas de bate-papo. Por favor, abra suas Configurações do perfil
Aviso legal
As informações e publicações não se destinam a ser, e não constituem, conselhos ou recomendações financeiras, de investimento, comerciais ou de outro tipo fornecidos ou endossados pela TradingView. Leia mais nos Termos de Uso.
Script protegido
Esse script é publicada como código fechado. No entanto, você pode gerenciar suas escolhas de bate-papo. Por favor, abra suas Configurações do perfil
Aviso legal
As informações e publicações não se destinam a ser, e não constituem, conselhos ou recomendações financeiras, de investimento, comerciais ou de outro tipo fornecidos ou endossados pela TradingView. Leia mais nos Termos de Uso.